


Transformation of Amazonian fruits into high-value beverages
Transformation of Amazonian fruits into high-value beverages
Business Model Description
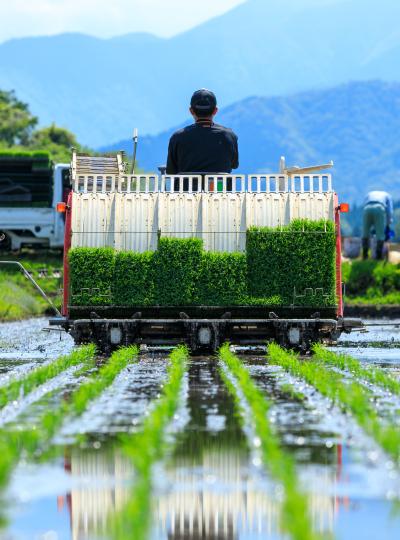
Transform Amazonian fruits into beverages with high nutritional value, collected and grown by indigenous communities in the jungle, preserving ancestral techniques and sustainable agriculture.
Expected Impact
Revaluing ancestral techniques and promoting sustainable agriculture to improve income in Amazonian indigenous communities
How is this information gathered?
Investment opportunities with potential to contribute to sustainable development are based on country-level SDG Investor Maps.
Disclaimer
UNDP, the Private Finance for the SDGs, and their affiliates (collectively “UNDP”) do not seek or solicit investment for programmes, projects, or opportunities described on this site (collectively “Programmes”) or any other Programmes, and nothing on this page should constitute a solicitation for investment. The actors listed on this site are not partners of UNDP, and their inclusion should not be construed as an endorsement or recommendation by UNDP for any relationship or investment.
The descriptions on this page are provided for informational purposes only. Only companies and enterprises that appear under the case study tab have been validated and vetted through UNDP programmes such as the Growth Stage Impact Ventures (GSIV), Business Call to Action (BCtA), or through other UN agencies. Even then, under no circumstances should their appearance on this website be construed as an endorsement for any relationship or investment. UNDP assumes no liability for investment losses directly or indirectly resulting from recommendations made, implied, or inferred by its research. Likewise, UNDP assumes no claim to investment gains directly or indirectly resulting from trading profits, investment management, or advisory fees obtained by following investment recommendations made, implied, or inferred by its research.
Investment involves risk, and all investments should be made with the supervision of a professional investment manager or advisor. The materials on the website are not an offer to sell or a solicitation of an offer to buy any investment, security, or commodity, nor shall any security be offered or sold to any person, in any jurisdiction in which such offer would be unlawful under the securities laws of such jurisdiction.
Country & Regions
- Macroregion Selva
- Region Lima y Callao
Sector Classification
Food and Beverage
Development need
- In 2022, the weight of the agricultural sector in the GDP is 6.1% (3)
- In December 2022, the year-on-year variation of the Agricultural Production Index was -0.96%, due to a decrease in agricultural activity of -2.43% (1)
- By the end of the year, the agricultural sector grew by 4.3% compared to the same period in 2021, driven by increased production in the Agricultural subsector (+5.5%) (2)
Policy priority
- Institutional Strategic Plan 2019-2024 (Modified) - MIDAGRI (Implement initiatives to improve agricultural services) (5).
- Agricultural Policy Guidelines: A guiding framework for decision-making by public and private sector actors (6).
- Food and Nutritional Security Law No. 31315: Development of public policies on food security (4).
Gender inequalities and marginalization issues
Income disparities between men and women can affect consumption patterns in the food and beverage sector, such as:
- The average income of women is 69.6% of men's income - INEI (Sep-2022) (10).
- In 2021, men's labor income increased by 10.7%, while it decreased by 1.1% for women(11)
Investment opportunities introduction
- In 2021: The country achieved a 13.6% GDP growth (12).
- The National Agricultural Policy (PNA) guides public investment towards providing services that strengthen the sector (14).
- Strategic National Development Plan 2050: proposes to improve rural infrastructure, enhance the productive and commercial capacity of farmers (7).
Key bottlenecks introduction
-Inflation was 6.43% in 2021 and 8.56% in 2022. This reduces the purchasing power of the population (15)(16).
- Agriculture in Peru has low productive efficiency, with 85% of farmers having plots smaller than 10 hectares (17).
- 17% of companies in the extractive sector reported difficulties in finding qualified personnel (18).
Beverages
Development need
-The market for processed foods and beverages represents 26.2% of the manufacturing GDP (approximately 3.7% of the total GDP) and has a significant presence in foreign markets, with exports reaching the equivalent of US$1,429 million (8).
- In June 2022, the production of processed beverages grew by 24.1% compared to 2021. When compared to 2019, the growth was 4.8% (13)."
Policy priority
- Legislative Decree No. 1062 - Food Safety Law and its Regulations (30).
- Regulation for the Surveillance and Sanitary Control of Food and Beverages (Supreme Decree No. 007-1998-SA) and its amendments (19).
- Sanitary Standard for the Implementation of the HACCP System in the Manufacture of Food and Beverages, Ministerial Resolution No. 449-2006/MINSA (20).
- NTP 125.001:2019 Palm Fruit. Aguaje - INACAL (21)."
Gender inequalities and marginalization issues
- The percentage of women working in the manufacturing sector has decreased from 9.5% in 2011 to 8.1% in 2021 (9).
- Indigenous communities in the jungle are vulnerable due to the access to their territory, which leads to unexpected changes in their habits and traditions (22).
Investment opportunities introduction
-The non-alcoholic beverage industry grew by 20.9% in the first half of 2021 compared to 2020 (23).
- In Latin America, it is anticipated that by 2030, the food and beverage industry's growth will surpass global averages. It is expected that they will increase their share from 12% in global exports of food and agricultural products (24).
Key bottlenecks introduction
- In the first 7 months of 2022, prices for food and non-alcoholic beverages increased by 9.49%, and when compared from July 2021 to July 2022, the price increase is 13.89% (25).
- Micro and small businesses (MYPEs) engaged in the services sector have a high concentration of informal workers, accounting for 72.1% of the workforce (26).
Non-Alcoholic Beverages
Pipeline Opportunity
Transformation of Amazonian fruits into high-value beverages
Transform Amazonian fruits into beverages with high nutritional value, collected and grown by indigenous communities in the jungle, preserving ancestral techniques and sustainable agriculture.
Business Case
Market Size and Environment
USD 50 million - USD 100 million
< 5%
The juice segment accounted for 8% of global sales in 2022 (USD 103.5 billion). Sales are expected to reach USD 129.5 billion by 2025, with an average annual growth rate of 8% between 2022 and 2025 (27).
Grupo AJE has projected 10% growth, with a focus on natural beverages (37).
Indicative Return
> 25%
Feasibility studies for the implementation of beverage production companies yield a return on investment ranging from 60% to 65%. (34)
Feasibility studies for the implementation of natural beverage production companies estimate a return on investment of 81% in 4 years. (35)
Investment Timeframe
Short Term (0–5 years)
The estimated payback period for a project implementing beverage production companies is 3 to 4 years (34) (35).
Ticket Size
USD 500,000 - USD 1 million
Market Risks & Scale Obstacles
Market - Politcal Instability
Market - Volatile
Business - Supply Chain Constraints
Impact Case
Sustainable Development Need
Sustainable fruit harvesting practices help prevent deforestation in the Amazon. Currently, deforestation has reached 17% over the last 50 years, primarily due to illegal logging and the expansion of migratory agricultural activities (36).
Gender & Marginalisation
Women constitute 43% of the agricultural workforce. However, they are often affected by restrictive sociocultural norms and gender stereotypes in our society, which frequently limit their ability to make decisions. (28)
Expected Development Outcome
Valuing the traditional activities of indigenous communities by generating sustainable income without impacting biodiversity or their cultural environment.
Gender & Marginalisation
Promoting responsible management of natural resources allows for the reduction of deforestation and other environmental issues. It also values sociocultural aspects, enabling communities to generate their own development through the new forms of work being promoted.
Primary SDGs addressed
9.2.1 Manufacturing value added as a proportion of GDP and per capita
Preservation of more than 100,000 hectares of forests in the Amazon.
By 2030, the goal is to improve agricultural sector competitiveness by 36% through vertical integration into the value chain of agricultural producers, reducing the proportion of family agricultural producers at the subsistence level, and enhancing the management of natural resources for sustainable agricultural production.
Secondary SDGs addressed
Directly impacted stakeholders
People
Gender inequality and/or marginalization
Corporates
Public sector
Indirectly impacted stakeholders
People
Planet
Corporates
Outcome Risks
Difficulty in the supply of raw materials due to political, social, or natural factors.
Groups of people who do not get to experience the nutraceutical benefits of products because they are not affordable within their family budget.
Impact Risks
Variability in the quality of products received at the time of raw material reception.
A reduced population available for this activity due to migration to other cities for dependent activities.
Impact Classification
What
Generation of income through sociocultural practices of indigenous communities
Who
Indigenous communities from which products obtained through forestry are purchased.
Risk
Shortage of raw materials - Inequality in the quality of raw materials at the time of collection.
Contribution
Increase in economic activities of indigenous communities. - Sustainable management of biodiversity
Impact Thesis
Revaluing ancestral techniques and promoting sustainable agriculture to improve income in Amazonian indigenous communities
Enabling Environment
Policy Environment
Strategic National Development Plan 2050: The State Policy, Territorial Planning and Management, promotes, among others, knowledge and research of the exceptional diversity of the territory and the sustainability of its ecosystems, and the promotion of dialogue, citizen participation and prior consultation with indigenous or native peoples (7).
Law on the Protection of Access to Peruvian Biological Diversity and the Collective Knowledge of Indigenous Peoples - Law No. 28216 (28).
Law on the Promotion of Investment in the Amazon - Law No. 27037 (29).
Financial Environment
Financial incentives: The National Forest Conservation Program of the Ministry of the Environment has 14 conservation agreements with native communities in various regions of the Amazon, through which economic incentives will be provided for the conservation of 355,098 hectares of communal forests.
Fiscal incentives: - The Investment Promotion Law in the Amazon - Law No. 27037 establishes tax benefits in the Income Tax and the General Sales Tax (IGV) for projects developed in the Amazon.
Other incentives: - The Private Investment Promotion Agency of the Amazon (Amazinv) aims to boost investment in the jungle with projects related to infrastructure, sanitation, agribusiness, timber, environmental businesses, aquaculture, tourism, and bio-commerce.
Regulatory Environment
Supreme Decree No. 013-2021-MIDAGRI - National Multisectoral Strategy to Combat Illegal Logging 2021-2025 - ENLTI (31).
Ministerial Resolution 591-2008/MINSA - Sanitary Standard establishing the microbiological criteria for sanitary quality and safety for food and beverages for human consumption (32).
Marketplace Participants
Private Sector
- Grupo Aje: AJE is a multinational beverage company of Peruvian origin with a presence in 23 countries across Latin America, Asia, and Africa.
Government
- National Forest and Wildlife Service (SERFOR): The National Authority for Forest and Wildlife, has as its main function the promotion of the sustainable management of the country's flora and wildlife; - SERNARP.
Multilaterals
The Green Initiative: International climate advisory and certification services company, responsible for the certification of Machu Picchu as the first carbon-neutral tourist destination in the world, as well as the certification of large companies such as Adidas and AJE Group."
Non-Profit
Conservacion Internacional
Public-Private Partnership
- Alianza Empresarial por la Amazonia
Target Locations

Macroregion Selva
Region Lima y Callao
References
- (1) INEI (2023). Informe técnico de producción nacional diciembre 2022.
- (2) MIDAGRI (2022). Informe del Valor Bruto de la Producción Agropecuaria.
- (3) BCRP (2023). Notas de estudios diciembre 2022
- (4) Congreso de la República (2021), Ley N° 31315 - Ley de seguridad alimentaria y nutriciona
- (5) MIDAGRI (2022), Plan Estratégico Institucional 2019-2024 (Modificado)
- (6) MIDAGRI (2015), Lineamiento de política agraria
- (7) PCM (2022), Plan Estratégido de Desarrollo Nacional al 2050
- (8) MEF (2022). Nota de Prensa Setiembre 2022
- (9) INEI (2022). Perú Brechas de Género 2022
- (10) INEI (2022). Estadísticas con Enfoque de Género
- (11) GOB.PE (2022). Brecha de ocupación laboral - Nota de Prensa
- (12) EY (2022). Guía de Negocios e Inversión en Agricultura y Agribusiness en el Perú 2022/2023
- (13) SNI (2022). Coyuntura Industrial. Desempeño en junio 2022
- (14) MIDAGRI (2021), D. S. N° 017-2021-MIDAGRI, Política Nacional Agraria 2021-2030
- (15) BCRP (2022). Reporte de Inflación . Diciembre 2022
- (16) INEI (2023). Variación de los Indicadores de precios de la Economía. Diciembre 2022
- (17) MIDAGRI (2022). Problemas tipo de la agricultura peruana
- (18) MTPE (2022). Encuesta de Demanda Ocupacional (EDO)
- (19) MINSA (1998). D. S. N° 007-1998-SA. Reglamento sobre Vigilancia y Control Sanitario de Alimentos y Bebidas
- (20) MINSA (2006). R.M. N° 449-2006/MINSA. Norma Sanitaria para la Aplicación del Sistema HACCP en la Fabricación de Alimentos y Bebidas
- (21) GOB.PE (2020). INACAL establece requisitos del aguaje para promover su comercialización en mercados
- (22) Mongabay (2022). Entrevista a Teresita Antazú, lideresa yanesha
- (23) MEF (2020). Listado de empresas Reactiva Perú
- (24) BID (2019). Innovaciones que están transformando el sector de alimentos y bebidas
- (25) INEI (2022). Variación de los indicadores de precio de la Economía. Julio 2022
- (26) MTPE (2021). Tablero Interactivo del Empleo Informal
- (27) ADEX (2022). Reporte de Tendencias. Bebidas no alcoólicas. Agosto 2022
- (28) Congreso de la República (2004). Ley de protección al acceso a la diversidad biológica peruana y los conocimientos colectivos de los pueblos indígenas. Ley N° 28216
- (29) Congreso de la República (1998). Ley de promoción de inversión en la Amazonía. Ley N° 27037
- (30) Presidencia de la República (2008), D. L. N° 1062. Ley de inocuidad de los alimentos
- (31) MIDAGRI (2021). D. S. N° 00013-2021-MIDAGRI. Aprueba la “Estrategia Nacional Multisectorial de Lucha contra la Tala Ilegal 2021 - 2025
- (32) MINSA (2008). R. M. N° 591-2008-MINSA. Aprueban “Norma Sanitaria que establece los criterios microbiológicos de calidad sanitaria e inocuidad para los alimentos y bebidas de consumo humano"
- (33) BIO AMAYU
- (34) PUCP (2019). Estudio de prefactibilidad para la producción y comercialización de una línea de nectares
- (35) GESTIÓN (2022). Mercado de jugos naturales
- (36) MONGABAY (2021) Perú alcanza cifra de deforestación más alta en los últimos 20 años
- (37) FORBES (2021), Grupo AJE proyecta crecimiento de 10% y pone foco en bebidas naturales 38 USIL (2021), ELABORACIÓN Y COMERCIALIZACIÓN DE BEBIDA NATURAL DE YACÓN CON PROPÓLEO