Sustainable, Sharing Economy and Micromobility Models for Transportation
Business Model Description
Investing in sustainable, sharing economy and micromobility models for transportation
Expected Impact
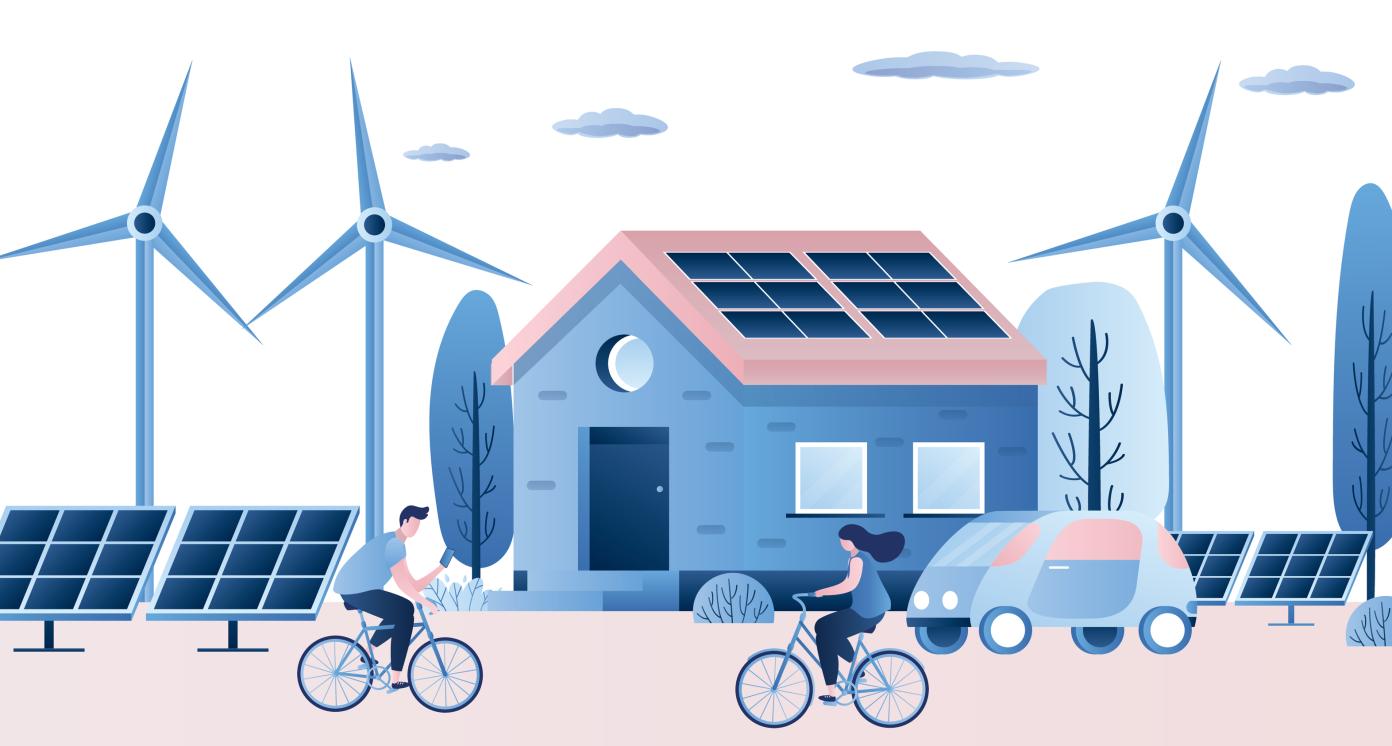
This IOA will increase the share of sustainable alternatives among urban transportation modes, thus reducing transportation-related CO2 emissions in the cities.
How is this information gathered?
Investment opportunities with potential to contribute to sustainable development are based on country-level SDG Investor Maps.
Disclaimer
UNDP, the Private Finance for the SDGs, and their affiliates (collectively “UNDP”) do not seek or solicit investment for programmes, projects, or opportunities described on this site (collectively “Programmes”) or any other Programmes, and nothing on this page should constitute a solicitation for investment. The actors listed on this site are not partners of UNDP, and their inclusion should not be construed as an endorsement or recommendation by UNDP for any relationship or investment.
The descriptions on this page are provided for informational purposes only. Only companies and enterprises that appear under the case study tab have been validated and vetted through UNDP programmes such as the Growth Stage Impact Ventures (GSIV), Business Call to Action (BCtA), or through other UN agencies. Even then, under no circumstances should their appearance on this website be construed as an endorsement for any relationship or investment. UNDP assumes no liability for investment losses directly or indirectly resulting from recommendations made, implied, or inferred by its research. Likewise, UNDP assumes no claim to investment gains directly or indirectly resulting from trading profits, investment management, or advisory fees obtained by following investment recommendations made, implied, or inferred by its research.
Investment involves risk, and all investments should be made with the supervision of a professional investment manager or advisor. The materials on the website are not an offer to sell or a solicitation of an offer to buy any investment, security, or commodity, nor shall any security be offered or sold to any person, in any jurisdiction in which such offer would be unlawful under the securities laws of such jurisdiction.
Country & Regions
- Turkey: Aegean Region
- Turkey: Central Anatolia Region
- Turkey: Marmara Region
- Turkey: Mediterranean Region
Sector Classification
Transportation
Development need
In 2020, Turkey ranked 47th (out of 160) in the Logistics Performance Index after being ranked 34th in 2016.(1) Connections between industrial facilities, ports and railway systems are not adequately developed. To improve competitiveness, Turkey needs to reduce logistics costs and develop combined transportation modes with higher shares of railway and maritime transportation.(5)
Gender inequalities and marginalization issues
Transport is a male-dominated sector, female participation in the transport sector is around 10% in Turkey. Additionally, inadequate transport infrastructure impacts women's access to work and education/skills-improvement, especially in rural areas. (19) Investments in transport infrastructure to incorporate new cities in the Turkish supply chain will decrease regional economic disparities
Investment opportunities
The total public investment in transportation is planned as 25 billion TRY (3.7 billion USD) with the largest shares going to railways (43%), highways (27%) and intracity transportation (23%).(7)
Key bottlenecks
Under-investment in transportation infrastructure poses supply-chain constraints for the exchange of products and services. As the population expands, the existing transportation infrastructure may be rendered insufficient. If transportation infrastructure is not developed, this will cause further issues in traffic congestion and reflect negatively on SDG 11.
Land Transportation
Development need
Significant challenges remain for Turkey's performance on SDG 11. % of public satisfied with public transport is well-below the long-term objective of 82.6% (at 57.81%). This indicator is exhibiting a trend of deterioration. The cities also exhibit great levels of air pollution. (2) This necessitates finding new and sustainable options to meet the demand for transport.
Policy priority
The 11th Development Plan highlights the need to encourage the use of sustainable transport options within cities such as bicycles. Object (703.5) notes that more bike sharing systems will be implemented. Moreover, the plan also highlights the need to address the pressure on public transport through sustainable alternatives
Gender inequalities and marginalization issues
Transport is a male-dominated sector, female participation in the transport sector is around 10% in Turkey. Additionally, inadequate transport infrastructure impacts women's access to work and education/skills-improvement, especially in rural areas. (19) Investments in transport infrastructure to incorporate new cities in the Turkish supply chain will decrease regional economic disparities
Investment opportunities
A 2019 report by McKinsey (3) highlights that around 50-60% of all passenger trips are less than 8 kilometers, and therefore offer a very high potential for micromobility solutions in urban areas. For these models, globally, a CAGR of 19.9% between 2019 and 2025 is estimated (4).
Key bottlenecks
An e-scooter requires a wide sidewalk or dedicated bicycle lane where a rider can ride it safely. Further challenges may be caused by the topograph of the cities and connectivity (4)
Road Transportation
Pipeline Opportunity
Sustainable, Sharing Economy and Micromobility Models for Transportation
Investing in sustainable, sharing economy and micromobility models for transportation
Business Case
Market Size and Environment
> USD 1 billion
15% - 20%
The global micro-mobility market which was valued at $3 billion in 2018, is projected to reach around $9.8 billion by 2025, at a CAGR of 19.9% between 2019 and 2025. (11)
Indicative Return
10% - 15%
15% - 20%
"Interviewed investors active in the Turkish technology space estimate an IRR at the 12-20% level from investments in this field. "
Gross margin for e-scooters as displayed by a US-based electronic scooter benchmark is around 19-33%.(12)
Investment Timeframe
Short Term (0–5 years)
There are already campaigns to increase cycling and/or proven business models such as Martı in Turkey.
Ticket Size
USD 1 million - USD 10 million
Market Risks & Scale Obstacles
Capital - Limited Investor Interest
Market - High Level of Competition
Impact Case
Sustainable Development Need
Calculations show that one car emits 115 grams of CO2 per kilometer, which could be prevented if a cycle journey is taken as an alternative. Consequently, over a five-kilometer journey, a total of 575 grams of CO2 could be prevented through bicycle use. (13)
The carbon-dioxide emissions rates caused by passenger transportation in Turkey are likely to double by 2030. (14)
A 2019 report by McKinsey (3) highlights that around 50-60% of all passenger trips are less than 8 kilometers. There is a need to switch to more sustainable options in such small routes to both decrease traffic congestion and reduce transport's footprint on the environment
Gender & Marginalisation
Safe and secure ways of transportation are needed to increase women's participation in the workplace and the public life.
Expected Development Outcome
"Reduce CO2 emissions from transportation and ensure traffic safety by increasing flexible and sustainable modes of transport such as cycling which can result in significant reductions in CO2 emissions and traffic accident fatalities and increase time saved on commuting."
Increase Turkish cities' alternative intracity transportation options by improving micro-mobility solutions while improving the 1.3% person per car rate. (11)
Gender & Marginalisation
Reduce unemployment / increase transportation alternatives for rural, female or inmigrant population
Increase women's participation in the workplace and public life through providing safe and secure transportation options
Primary SDGs addressed

8.4.1 Material footprint, material footprint per capita, and material footprint per GDP
16 tonnes per capita (15)

9.1.2 Passenger and freight volumes, by mode of transport
"Only available for train and air transport. Railway passengers carried: 4.39 billion passenger-km (15)"

11.2.1 Proportion of population that has convenient access to public transport, by sex, age and persons with disabilities
"Not available Although SDG Dashboard's satisfaction with transport index is similar: 57.81% (16)"
"Not available Although SDG Dashboard's satisfaction with transport index is similar: 82.6% (16)"
Secondary SDGs addressed

Directly impacted stakeholders
People
Gender inequality and/or marginalization
Planet
Corporates
Public sector
Indirectly impacted stakeholders
People
Outcome Risks
Use of scooters and bicycles outside bicycle lanes may result in increased traffic accidents.
Impact Risks
Execution Risk
Impact Classification
What
Increased share of environment-friendly modes in urban transportation.
Who
Micromobility solutions especially benefit urban population by providing an affordable and flexible mode of transport and increasing time saved on commuting.
Risk
Medium Risk (Technological risks may cause disruptions in services.The use of micromobility services outside allotted lanes may increase traffic accidents.)
Impact Thesis
This IOA will increase the share of sustainable alternatives among urban transportation modes, thus reducing transportation-related CO2 emissions in the cities.
Enabling Environment
Policy Environment
Turkey will undertake its first promotional campaign - "Get Turkey Cycling!" with a European Union (EU) fund that aims to encourage bicycle usage in urban areas. (17)
(11th Development Plan): The 11th Development Plan highlights the need to promote sustainable transportation models in the cities. It also details plans to develop bikelines and promote bike sharing as transportation alternative in congested cities
(2019-2023 Strategic Plan of the Ministry of Infrastructure and Transportation): The 2019-2023 Strategic Plan of the Ministry of Infrastructure and Transportation calls for the development of sustainable transportation infrastructure in the cities
Financial Environment
Financial incentives: In April, the European Union awarded WRI Turkey Sustainable Cities funding from the Civil Society Support Programme II for the “Get Turkey Cycling!” campaign (18)
Other incentives: The Ministry of Industry and Technology and The Development and Investment Bank of Turkey established "The Technology and Innovation Fund" under the Turkey Development Fund to finance innovative tech. based companies/projects with a budget of 350 million TRY.
Regulatory Environment
(Regulation): Any kind of electric vehicle over 0.25Kw and/or with a higher maximum speed of 25 Kmph should be registered.
(Regulation): To ride a bike over 0.25 Kw you must hold a Motorbike Driving Licence.
(Regulation): All e-scooters and e-bikes must be insured.
Marketplace Participants
Private Sector
VC Firms such as 212 and Wamda Capital (Martı investors), Vinci, companies like Martı, Zipcar, Blablacar, Voltlines, Zorlu.
Government
Metropolitan Municipalities.
Multilaterals
European Union (EU)
Non-Profit
World Resources Institute Turkey Sustainable Cities Association (WRITRSC) / Embarq Turkey, İTÜ Çekirdek, Solarbaba, TEHAD.
Target Locations
Turkey: Aegean Region
Turkey: Central Anatolia Region
Turkey: Marmara Region
Turkey: Mediterranean Region
References
- (1) World Bank, 2018, https://lpi.worldbank.org/international/scorecard/radar/56/C/TUR/2018/C/DEU/2018
- (2) SDG Index & Dashboards, 2020, https://dashboards.sdgindex.org/profiles/TUR
- (3) McKinsey & Company, 2019, https://www.mckinsey.com/industries/automotive-and-assembly/our-insights/micromobilitys-15000-mile-checkup
- (4) Coruscate, 2020. https://www.coruscatesolution.com/start-e-scooter-sharing-business-in-turkey/
- (5) Presidency of Strategy and Budget, 2020, http://www.sbb.gov.tr/wp-content/uploads/2020/03/On_BirinciPLan_ingilizce_SonBaski.pdf
- (6) State Railways of Rep. of Turkey, 2019, http://www.sp.gov.tr/upload/xSPStratejikPlan/files/wyMtM+20192023sp.pdf
- (7) Presidency of Strategy and Budget, 2020, http://www.sbb.gov.tr/wp-content/uploads/2020/03/2020_Yatirim_Programi.pdf
- (8) Presidency of Strategy and Budget, 2019, https://sustainabledevelopment.un.org/content/documents/23862Turkey_VNR_110719.pdf
- (9) Presidency of Strategy and Budget, 11th Development Plan, http://www.sbb.gov.tr/wp-content/uploads/2020/03/On_BirinciPLan_ingilizce_SonBaski.pdf
- (10) Presidency of Strategy and Budget, 2020, http://www.sbb.gov.tr/wp-content/uploads/2019/11/2020_Yili_Cumhurbaskanligi_Yillik_Programi.pdf
- (11) Coruscate, 2020. https://www.coruscatesolution.com/start-e-scooter-sharing-business-in-turkey/
- (12) Inc. https://www.inc.com/magazine/201902/will-yakowicz/bird-electric-scooter-travis-vanderzanden-2018-company-of-the-year.html
- (13) Anadolu Agency, 2019. Turkey launches 1st communication drive for cycle lanes. https://www.aa.com.tr/en/economy/turkey-launches-1st-communication-drive-for-cycle-lanes/1478938
- (14) Bianet, https://m.bianet.org/bianet/ekoloji/207100-turkiye-de-ulasim-sebebiyle-salinan-emisyon-orani-2030-da-iki-katina-cikacak
- (15) SDG Tracker, 2020, https://sdg-tracker.org/
- (16) SDG Index & Dashboard, 2020, https://dashboards.sdgindex.org/profiles/TUR/indicators
- (17) Anadolu Agency, 2019. Turkey launches 1st communication drive for cycle lanes. https://www.aa.com.tr/en/economy/turkey-launches-1st-communication-drive-for-cycle-lanes/1478938
- (18) WRI, 2019. 'Get Turkey Cycling!' Campaign Takes Off in 3 Turkish Cities. https://wrirosscities.org/news/get-turkey-cycling-campaign-takes-three-turkish-cities
- (19) European Bank of Reconstruction and Development, Transportation Strategy 2019-2024, https://www.ebrd.com/documents/transport/strategy-for-transport.pdf
- (20) Turkis Statistical Services, 2021. https://cip.tuik.gov.tr/#.


