


Sustainable food and cash crop production
Sustainable food and cash crop production
Business Model Description
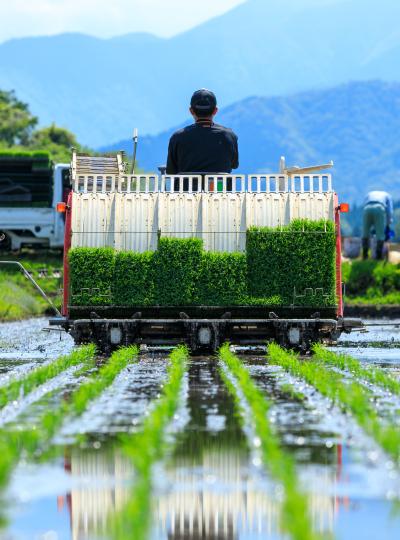
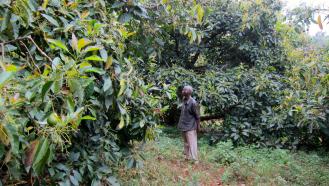
Undertake sustainable production of cash crops and food crops, especially coffee, tea, coconuts, nuts and oils crops, maize, sugar and horticulture.
Expected Impact
Contribute to food security, reduce food costs and minimize environmental degradation.
How is this information gathered?
Investment opportunities with potential to contribute to sustainable development are based on country-level SDG Investor Maps.
Disclaimer
UNDP, the Private Finance for the SDGs, and their affiliates (collectively “UNDP”) do not seek or solicit investment for programmes, projects, or opportunities described on this site (collectively “Programmes”) or any other Programmes, and nothing on this page should constitute a solicitation for investment. The actors listed on this site are not partners of UNDP, and their inclusion should not be construed as an endorsement or recommendation by UNDP for any relationship or investment.
The descriptions on this page are provided for informational purposes only. Only companies and enterprises that appear under the case study tab have been validated and vetted through UNDP programmes such as the Growth Stage Impact Ventures (GSIV), Business Call to Action (BCtA), or through other UN agencies. Even then, under no circumstances should their appearance on this website be construed as an endorsement for any relationship or investment. UNDP assumes no liability for investment losses directly or indirectly resulting from recommendations made, implied, or inferred by its research. Likewise, UNDP assumes no claim to investment gains directly or indirectly resulting from trading profits, investment management, or advisory fees obtained by following investment recommendations made, implied, or inferred by its research.
Investment involves risk, and all investments should be made with the supervision of a professional investment manager or advisor. The materials on the website are not an offer to sell or a solicitation of an offer to buy any investment, security, or commodity, nor shall any security be offered or sold to any person, in any jurisdiction in which such offer would be unlawful under the securities laws of such jurisdiction.
Case Studies
Country & Regions
- Kenya: Coast
- Kenya: Western
- Kenya: Central
- Kenya: Eastern
- Kenya: Rift Valley
Sector Classification
Food and Beverage
Development need
According to the Sustainable Development Report, SDG 2 - Zero Hunger is a major challenge in Kenya and the overall score for this goal is stagnating. The COVID-19 crisis contributes to price fluctuations, food insecurity and supply chains disruptions. Food inflation in Kenya reached 10.6% in March 2020, compared with 2.8% in the same month in the previous year.(1)
Policy priority
Policy documents and initiatives such as the Third Medium Term Plan, the Kenyan Vision 2030 and the Agricultural Sector Growth and Transformation Strategy highlight the potential of agriculture for national development. Achieving food security is among Kenya's top four policy priorities according to its 'Big Four Agenda'.
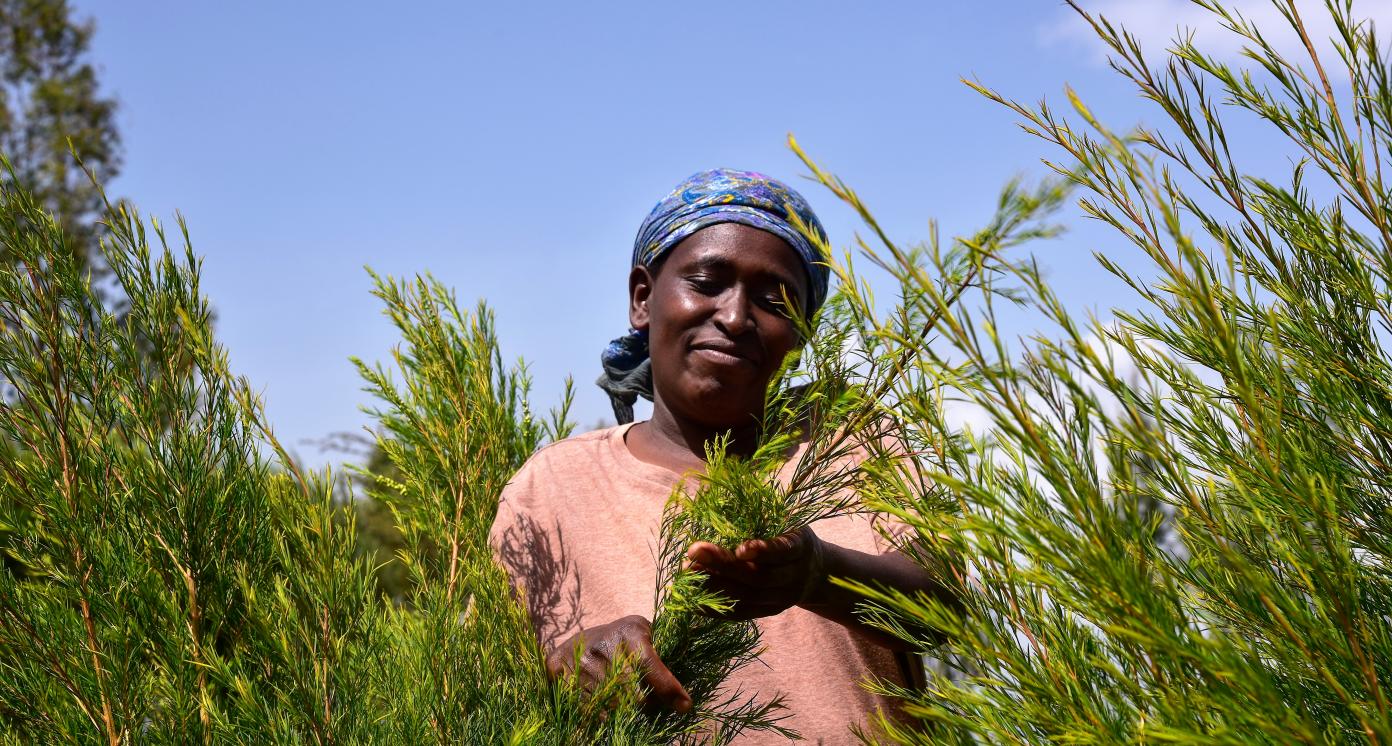
Gender inequalities and marginalization issues
Women constitute almost 80% of agricultural workers in Kenya. Yet, they often do not have any ownership of farming lands or production equipment. They also suffer from an unequal access to relevant agricultural loans.(33)
Investment opportunities introduction
Accounting for 34% of Kenyan gross domestic product (GDP)(2), agriculture is the main employer of the Kenyan population. Total sales in agriculture reached USD 26.5 billion in 2019 and are expected to grow at an average rate of 1.52% in 2020-2025.(3)
Key bottlenecks introduction
Some critical bottlenecks include poor education and management skills among farmers, business atomization, supply chain deficiencies, limited access to capital and inputs, lack of storage and poor handling practices, low access to information and ICT (information and communications technology) services, as well as the aging farming population.
Food and Agriculture
Development need
Kenyan households that are engaged in the agriculture sector contribute 31.4% to the reduction of rural poverty. Agriculture is the largest income source for both poor and non-poor households in rural areas.(4) However, major challenges remain for Kenya's SDG 2 performance, particularly in undernourishment, stunting, cereal yield and nitrogen management.(5)
Investment opportunities introduction
The government aims to provide access to land, security, power and water supply to attract private sector investors in agriculture.(6) Several priority programs were established to revitalize agriculture in Kenya such as the Agricultural Development Program along the LAPSSET (Lamu Port, South Sudan, Ethiopia) corridor, Agri-Business Development Program, and the Revitalising of the Coconut Industry Program.(7)
Agricultural Products
Pipeline Opportunity
Sustainable food and cash crop production
Undertake sustainable production of cash crops and food crops, especially coffee, tea, coconuts, nuts and oils crops, maize, sugar and horticulture.
Business Case
Market Size and Environment
Average annual expenditure on food per capita of USD 729 million.
Kenya's population was 46 million in 2020 and is projected to increase to 86 million by 2050.(11) This growth means the scale of Kenya's food production must increase.
The middle class accounts for almost half of the Kenyan population (a significantly higher share than the regional average - 22.6% for East Africa)(12).
This translates into higher household consumption and food expenditure (average expenditure on food per capita in Kenya rose from USD 269 in 2009 to USD 729 in 2018), showing the increasing potential and need to further expand sustainable production of food crops and cash crops.(13)
Indicative Return
15% - 20%
Benchmark statistics for the agriculture subsector estimate a rate of return between 13.8% and 17.8%. This rate is a benchmark calculated as a cost of equity with country risk premium, reflecting an average return required by investors.(14)
Investment Timeframe
Long Term (10+ years)
The investment timeframe in the Kenya Agricultural Productivity and Agri-business Development Project was estimated at 20 years.(15)
Ticket Size
< USD 500,000
Market Risks & Scale Obstacles
Business - Supply Chain Constraints
Business - Supply Chain Constraints
Risks related to climate change
Impact Case
Sustainable Development Need
Most Kenyan households in rural areas engage in agricultural production or related activities. 54% of the population is employed in agriculture in 2020. However, the value added per worker (based on 2010 constant prices) is lower than it used to be 15 years ago at USD 1,120.(2)
Despite the overall improvements on development levels, important challenges remain for SDG 1 - No Poverty, SDG 2 - Zero Hunger and SDG 8 - Decent Work and Economic Growth. Productivity levels in agricultural outputs remain low, and the cereal yield indicator shows a major challenge with only 1.5 tons/ha.(5)
From 1990 to 2014, the country's food production grew around 2.8% annually. But since 2015, growth has slowed significantly to 0.6% per year. Combined with rapid population growth, this puts additional pressure to increase the country's productivity levels.(6)
Gender & Marginalisation
Women constitute almost 80% of agricultural workers in Kenya. Yet, they often do not have any ownership of farming lands or production equipment. They also suffer from an unequal access to relevant agricultural loans.(33)
Expected Development Outcome
Improved food security for the entire nation and nutrition at household level; increased agricultural value chain development; provision of export opportunities/foreign exchange earnings, new market opportunities and economies of scale, improved quality and quantity of food crops and cash crops
Gender & Marginalisation
Increased employment opportunities especially for youth and females due to the development of the agricultural sector
Primary SDGs addressed
1.1.1 Proportion of the population living below the international poverty line by sex, age, employment status and geographic location (urban/rural)
1.2.1 Proportion of population living below the national poverty line, by sex and age
36.80% (share of the population living in extreme poverty-international poverty line) (34)
36.1% (share of the population living in extreme poverty-national poverty line) (34)
0%
0%
2.1.1 Prevalence of undernourishment
2.1.2 Prevalence of moderate or severe food insecurity in the population, based on the Food Insecurity Experience Scale (FIES)
2.3.1 Volume of production per labour unit by classes of farming/pastoral/forestry enterprise size
29.4% (34)
56.5% (34)
Agricultural value added per worker: USD 1,987.13 (34)
0%
0%
By 2030, double the average productivity of food producers
Secondary SDGs addressed
Directly impacted stakeholders
People
Gender inequality and/or marginalization
Planet
Indirectly impacted stakeholders
People
Corporates
Outcome Risks
Aquifers, river systems and downstream groundwater may be at risk of depletion from increased water extraction following irrigation activities.(19)
Waterlogging and salinization of soils resulting from potential irrigation schemes are also risks, which need to be addressed while planning the investment process.(20)
Conversion of a natural land cover into the managed systems for agriculture.(21)
Impact Risks
Gender inequality and/or marginalization risk: Any negative environmental outcome will predominantly impact the main source of income for women and rural households, that is farming lands.
Impact Classification
What
Investments in sustainable production of food and cash crops, which contributes to food security, reduces costs, prevents pollution and minimizes environmental degradation.
Who
Farmers and households living from agricultural production, as well as Kenyan citizens and government benefitting from quality products, increased production and a positive trade balance.
Risk
Although the model is proven in the market, there are some risks related with water scarcity and land use change (if new land will be converted into a cropland)
Impact Thesis
Contribute to food security, reduce food costs and minimize environmental degradation.
Enabling Environment
Policy Environment
10 Year Agricultural Sector Growth and Transformation Strategy: This strategy emphasizes the need to use the country's intrinsic production potential, noting there are over 2.5 million acres of unutilized arable land. Further, cultivated land produces lower yields compared with other countries in the region.(6)
The Third Medium Term Plan, the Big Four Priority Agenda 2017-2022 and the Agricultural Sector Growth and Transformation Strategy (ASTGS) highlight the need to improve agricultural productivity and to provide food and nutrition for all Kenyans.
Several agricultural priority programs have been established by the government such as: Agricultural Development along the LAPSSET corridor; the Agri-Business Development Program; Revitalising of the Coconut Industry Program and others.(22)
Financial Environment
Financial incentives: No financial incentives dedicated directly and exclusively to sustainable crop production have been identified in Kenya. However, other incentives as described below might be available on a project-by-project basis.
Fiscal incentives: Depending on the project, Export Processing Zones (EPZs) offer incentives such as: a 10-year corporate income tax holiday and a 25% tax rate for 10 more years; perpetual exemption from VAT (value added tax) and customs duty for inputs; exemption from stamp duty fees; 100% investment deductions in EPZ building and machinery investments for 20 years.(28)
Other incentives: Depending on the project, farm work deductions might be available, which allows a 100% deduction on the immovable buildings for properly operating the farm. (21). There is a wear and tear deduction of 37.5% for Class I category (heavy machinery, tractors etc.). (29)
Regulatory Environment
The Food Crops Industry Bill 2020: This Bill regulates the development and promotion of the food crops industry (including growers registration, taxation and licensing) and establishes the Food Crops Regulatory Authority.(23)
The Coffee Bill 2020: This Bill provides licensing and growers' registration as well as production, processing, trading and marketing related regulations. It establishes a Coffee Board, a Coffee Council and the Coffee Research Institute.(24)
Nuts and Oil Crops Bill 2020: This Bill provides licensing and growers' registration as well as production, processing, trading and marketing related regulations. It establishes the Nuts and Oil Crops Board and the Nuts and Oil Crops Council.(25)
Fibre Crops Bill 2020: This Bill provides licensing and growers' registration as well as production, processing, trading and marketing related regulations. It establishes the Fiber Crops Council.(26)
Horticultural Crops Authority Bill 2020: This Bill provides licensing and growers registration as well as production, processing, marketing and promotion related regulations. It establishes the Horticultural Crops Authority.(27)
Marketplace Participants
Private Sector
Maguta Coffee Estate, Gikanda Farmers Cooperative Society Ltd, KTDA Holdings Ltd, West Kenya Sugar Ltd, Amandus Kahl GmbH & Co. KG
Government
Ministry of Agriculture, Livestock and Fisheries
Multilaterals
International Monetary Fund (IMF), World Bank (WB), European Investment Bank (EIB), African Development Bank (AfDB), KfW Development Bank, Agence Française de Développement (AFD), Acumen, AHL Venture Partners, DOB Equity
Non-Profit
Kenya Agricultural Research Institute, Kenya Agricultural and Livestock Research Organization, Centre for Agriculture and Biosciences International (CABI), Food and Agriculture Organization of the United Nations (FAO), German Corporation for International Cooperation(GIZ)
Target Locations

Kenya: Coast
Kenya: Western
Kenya: Central
Kenya: Eastern
Kenya: Rift Valley
References
- (1) World Bank (2020). Kenya Economic Update: Turbulent Times for Growth in Kenya.
- (2) World Bank database, 2020. https://data.worldbank.org/
- (3) ISIC Classification Revision. Comparative Industry Forecast Tables - Agriculture.
- (4) World Bank (2019). Unbundling the Slack in Private Sector Investment: Transforming Agriculture Sector Productivity and Linkages to Poverty Reduction. April 2019 | Edition No. 19.
- (5) Sachs, J., Schmidt-Traub, G., Kroll, C., Lafortune, G., Fuller, G., Woelm, F. (2020). The Sustainable Development Goals and COVID-19. Sustainable Development Report 2020. Cambridge: Cambridge University Press.
- (6) Ministry of Agriculture (2019). Agricultural Sector Transformation and Growth Strategy: Towards Sustainable Agricultural Transformation and Food Security in Kenya 2019-2029.
- (7) Government of Kenya. National Agriculture Investment Plan (NAIP) 2019-2024. http://extwprlegs1.fao.org/docs/pdf/ken189052.pdf
- (8) World Bank (2020). Kenya Economic Update: Turbulent Times for Growth in Kenya,
- (9) Food and Agriculture Organization of the United Nations. Agriculture Policies Database for Kenya.
- (10) Ministry of Agriculture (2019). Agricultural Sector Transformation and Growth Strategy: Towards Sustainable Agricultural Transformation and Food Security in Kenya 2019-2029.
- (11) Fengler, W. (2010). Demographic Transition and Growth in Kenya. World Bank.
- (12) Oxford Business Group. Consumer goods producers benefit from Kenya's growing middle class.
- (13) Knoema (2018). Kenya - Expenditure on food per capita.
- (14) PwC analysis based on Prof. A. Damodaran data, 2020.
- (15) World Bank (2019). Agricultural Productivity Program KAPP I and II: Kenya. https://ieg.worldbankgroup.org/sites/default/files/Data/reports/ppar_kenyaagriculture.pdf
- (16) Birch, I. (2018). Agricultural Productivity In Kenya: Barriers And Opportunities. https://assets.publishing.service.gov.uk/media/5c70028ee5274a0ecbe9a1c2/483_Agricultural_Productivity_in_Kenya_Barriers_and_Opportunities.pdf
- (17) Kari.org. (2019). The Major Challenges Of The Agricultural Sector In Kenya. https://www.kari.org/the-major-challenges/
- (18) Gashu, D., Demment, M. and Stoecker, B. (2019). 'Challenges And Opportunities To The African Agriculture And Food Systems'. African Journal of Food, Agriculture, Nutrition and Development. https://www.ajol.info/index.php/ajfand/article/view/185585
- (19) National Geographic Society (2020). Environmental Impacts of Agricultural Modifications. https://www.nationalgeographic.org/article/environmental-impacts-agricultural-modifications/
- (20) Food and Agriculture Organization of the United Nations (FAO) (1997). Irrigation Potential In Africa: A Basin Approach. Rome: FAO Land and Water Development Division. http://www.fao.org/3/W4347E/w4347e00.htm#Contents
- (21) Pennock, D. and McKenzie, N. (2015). Status of the World’s Soil Resources. Food and Agriculture Organization of the United Nations (FAO). http://www.fao.org/3/a-i5126e.pdf
- (22) Kenya Vision 2030. Economic and Macro Pillar: Moving the Economy Up the Value Chain. https://vision2030.go.ke/economic-pillar/#88
- (23) Ministry of Agriculture, Livestock and Fisheries (2020). Food Crops Industry Bill. Republic of Kenya. https://www.kilimo.go.ke/wp-content/uploads/2020/10/DRAFT-FOOD-CROPS-INDUSTRY-BILL-FINAL.pdf
- (24) Ministry of Agriculture, Livestock and Fisheries (2020). Coffee Bill. Republic of Kenya. https://www.kilimo.go.ke/wp-content/uploads/2020/10/THE-COFFEE-BILL-2020.pdf
- (25) Ministry of Agriculture, Livestock and Fisheries (2020). Nuts And Oil Crops Bill. Republic of Kenya. https://www.kilimo.go.ke/wp-content/uploads/2020/11/NUTS-AND-OIL-CROPS-BILL-2020-1-9-2020.pdf
- (26) Ministry of Agriculture, Livestock and Fisheries (2020). Fibre Crops Bill. Republic of Kenya. https://www.kilimo.go.ke/wp-content/uploads/2020/10/DRAFT-Fibre-Crops-Bill-2020-Changes-Accepted.pdf
- (27) Ministry of Agriculture, Livestock and Fisheries (2020). Horticultural Crops Authority Bill. Republic of Kenya. https://www.kilimo.go.ke/wp-content/uploads/2020/10/HCD-BILL.pdf
- (28) Department of Economic and Social Affairs (2019). Growing at a slower pace, world population is expected to reach 9.7 billion in 2050 and could peak at nearly 11 billion around 2100.
- (29) United Nations General Assembly (2009). Food Production Must Double by 2050 to Meet Demand from World’s Growing Population, Innovative Strategies Needed to Combat Hunger, Experts Tell Second Committee. GA/EF/3242. https://www.un.org/press/en/2009/gaef3242.doc.htm#:~:text=Food%20production%20must%20double%20by%202050%20to%20meet%20the%20demand,a%20panel%20discussion%20on%20%E2%80%9CNew
- (30) Viffa Consult (2020). State of coconut commodity market in Kenya: SME Market Opportunity Outlook. http://viffaconsult.co.ke/wp-content/uploads/2020/07/State-of-Coconut-Commodity-Market-in-Kenya.pdf
- (31) KENCAFFEE (2020). Kenya's coffee growing regions. https://www.kencaffee.coop/coffee-growing-regions-in-kenya/
- (32) International Finance Corporation (2014). Development Impact Case Study: Supporting Sustainable Coffee Production in Kenya. https://www.ifc.org/wps/wcm/connect/news_ext_content/ifc_external_corporate_site/news+and+events/news/za_ifc_study_kenya_coffee
- (33) Deutsche Welle (2013). Women take over Kenya's farming sector. https://www.dw.com/en/women-take-over-kenyas-farming-sector/a-16716322
- (34) SDG Tracker (2021). End poverty in all its forms everywhere. https://sdg-tracker.org/no-poverty