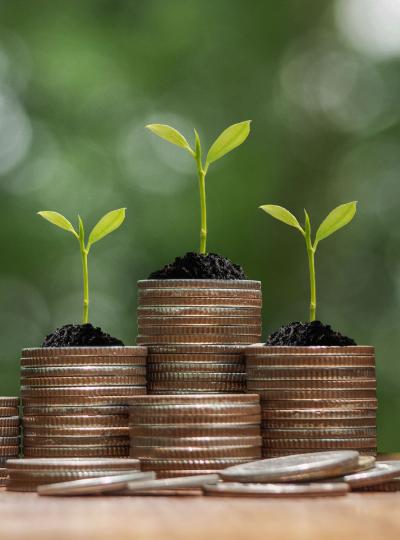


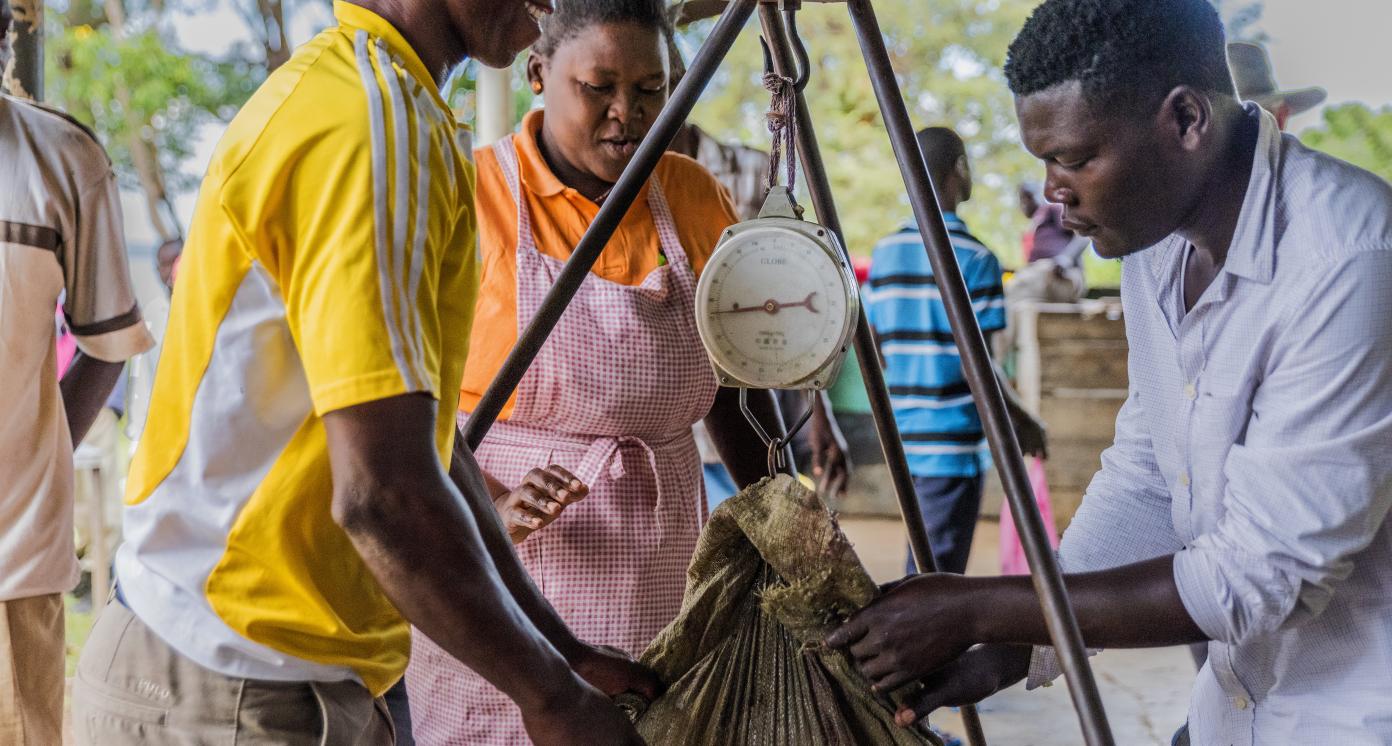
Sustainable fish production
Sustainable fish production
Business Model Description
Undertake sustainable breeding and production of high-value fish, such as tilapia or catfish.
Expected Impact
Contribute to food security in Kenya, increase protein intake and reduce malnutrition in the general population and stunting in children.
How is this information gathered?
Investment opportunities with potential to contribute to sustainable development are based on country-level SDG Investor Maps.
Disclaimer
UNDP, the Private Finance for the SDGs, and their affiliates (collectively “UNDP”) do not seek or solicit investment for programmes, projects, or opportunities described on this site (collectively “Programmes”) or any other Programmes, and nothing on this page should constitute a solicitation for investment. The actors listed on this site are not partners of UNDP, and their inclusion should not be construed as an endorsement or recommendation by UNDP for any relationship or investment.
The descriptions on this page are provided for informational purposes only. Only companies and enterprises that appear under the case study tab have been validated and vetted through UNDP programmes such as the Growth Stage Impact Ventures (GSIV), Business Call to Action (BCtA), or through other UN agencies. Even then, under no circumstances should their appearance on this website be construed as an endorsement for any relationship or investment. UNDP assumes no liability for investment losses directly or indirectly resulting from recommendations made, implied, or inferred by its research. Likewise, UNDP assumes no claim to investment gains directly or indirectly resulting from trading profits, investment management, or advisory fees obtained by following investment recommendations made, implied, or inferred by its research.
Investment involves risk, and all investments should be made with the supervision of a professional investment manager or advisor. The materials on the website are not an offer to sell or a solicitation of an offer to buy any investment, security, or commodity, nor shall any security be offered or sold to any person, in any jurisdiction in which such offer would be unlawful under the securities laws of such jurisdiction.
Country & Regions
- Kenya: Central
- Kenya: Western
- Kenya: Nyanza
- Kenya: Eastern
Sector Classification
Food and Beverage
Development need
According to the Sustainable Development Report, SDG 2 - Zero Hunger is a major challenge in Kenya and the overall score for this goal is stagnating. The COVID-19 crisis contributes to price fluctuations, food insecurity and supply chains disruptions. Food inflation in Kenya reached 10.6% in March 2020, compared with 2.8% in the same month in the previous year.(1)
Policy priority
Policy documents and initiatives such as the Third Medium Term Plan, the Kenyan Vision 2030 and the Agricultural Sector Growth and Transformation Strategy highlight the potential of agriculture for national development. Achieving food security is among Kenya's top four policy priorities according to its 'Big Four Agenda'.
Gender inequalities and marginalization issues
Women constitute almost 80% of agricultural workers in Kenya. Yet, they often do not have any ownership of farming lands or production equipment. They also suffer from an unequal access to relevant agricultural loans.(32)
Investment opportunities introduction
Accounting for 34% of Kenyan gross domestic product (GDP)(2), agriculture is the main employer of the Kenyan population. Total sales in agriculture reached USD 26.5 billion in 2019 and are expected to grow at an average rate of 1.52% in 2020-2025.(3)
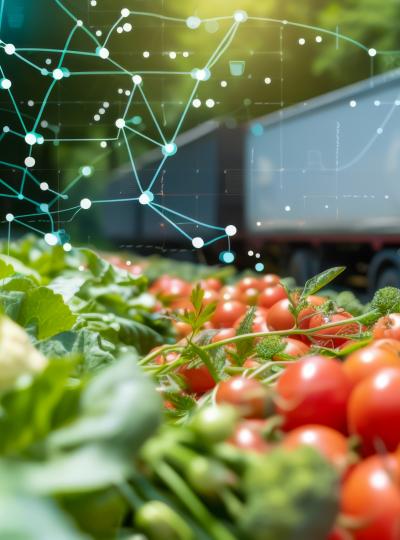
Key bottlenecks introduction
Some critical bottlenecks include poor education and management skills among farmers, business atomization, supply chain deficiencies, limited access to capital and inputs, lack of storage and poor handling practices, low access to information and ICT (information and communications technology) services, as well as the aging farming population.
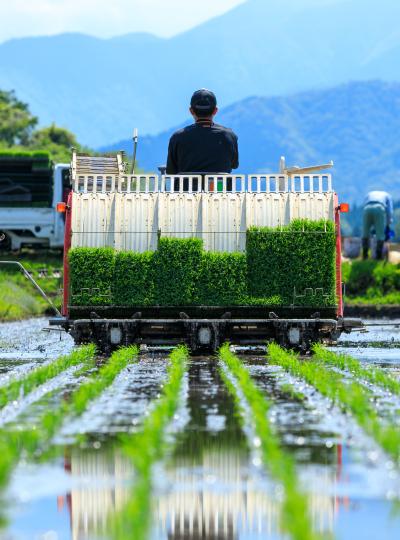
Food and Agriculture
Development need
Kenyan households that are engaged in the agriculture sector contribute 31.4% to the reduction of rural poverty. Agriculture is the largest income source for both poor and non-poor households in rural areas.(4) However, major challenges remain for Kenya's SDG 2 performance, particularly in undernourishment, stunting, cereal yield and nitrogen management.(5)
Investment opportunities introduction
The government aims to provide access to land, security, power and water supply to attract private sector investors in agriculture.(6) Several priority programs were established to revitalize agriculture in Kenya such as the Agricultural Development Program along the LAPSSET (Lamu Port, South Sudan, Ethiopia) corridor, Agri-Business Development Program, and the Revitalising of the Coconut Industry Program.(7)
Meat, Poultry and Dairy
Pipeline Opportunity
Sustainable fish production
Undertake sustainable breeding and production of high-value fish, such as tilapia or catfish.
Business Case
Market Size and Environment
10% - 15%
Amount of aquaculture captured: 15,000 tons in 2018; land available for fish breeding: 1.14 million ha
Market analysis estimates the sales of fish and fish products in Kenya will grow by around 10% annually from 2020-2024, to USD 2 billion.(10)
Total aquaculture production reached 15,000 tons in 2018, compared with 12,000 tons from capture. Over 90% of bred fish consist of tilapia species.(11)
The Food and Agriculture Organization (FAO) reports aquaculture has a high potential in Kenya, with 1.14 million ha of area suitable for fish breeding. This can translate to 11 million metric tons of fish worth around USD 7.3 billion.(12)
Indicative Return
10% - 15%
A case study of Meru county reported an internal rate of return (IRR) of 10-13%.(13)
A tilapia farm in Mozambique (a regional benchmark) reported an IRR of 10%-20% in total and 40%-46% on equity.(14)
Some investments in Zambia give an IRR of 42%, although the return profile of scaling aquaculture and fish breeding may differ depending on the size and kind of investment.(15)
Investment Timeframe
Medium Term (5–10 years)
A tilapia farm in Mozambique (a regional benchmark) reported a payback period of 8 years.(14)
A case study in Meru county reported an 11-year payback period on a 15-year aquaculture project.(13)
In Zambia (another regional benchmark), the fish breeding pond had a useful life of 10 years.(15)
Ticket Size
USD 500,000 - USD 1 million
Market Risks & Scale Obstacles
Capital - Requires Subsidy
Business - Supply Chain Constraints
Lack of government support and training
Impact Case
Sustainable Development Need
SDG 2 - Zero Hunger and SDG 8 - Decent Work and Economic Growth presented as major and significant challenges respectively. The indicators signal existing undernutrition caused by lack of protein (which can be provided from fish) and presence of overfishing.(5)
In Kenya, average protein intake equalled 62 g which is lower than the African average. This problem may be solved be increasing the availability of affordable fish, which are rich in protein and other health micronutrients.(18)
To maintain current fish consumption in light of dwindling fish stock and rapidly raising population, fish breeding must increase to 150,000 tons by 2030. If Kenya would like to reach the African average, then production must increase to 550,000 tons by 2030.(18)
Gender & Marginalisation
Women constitute almost 80% of agricultural workers in Kenya. Yet, they often do not have any ownership of farming lands or production equipment. They also suffer from an unequal access to relevant agricultural loans.(32)
Expected Development Outcome
Increased value and volume of fish production
Reduced malnutrition and stunting
Improved fishing methods and fish science, mitigation measures for overfishing
Gender & Marginalisation
Increased employment opportunities especially for youth and females due to the development of the agricultural sector
Primary SDGs addressed
2.1.1 Prevalence of undernourishment
2.2.1 Prevalence of stunting (height for age <-2 standard deviation from the median of the World Health Organization (WHO) Child Growth Standards) among children under 5 years of age
29.4% (33)
26% of children under 5 (33)
0%
0%
8.1.1 Annual growth rate of real GDP per capita
8.4.1 Material footprint, material footprint per capita, and material footprint per GDP
2.27% in 2017 (33)
Domestic material consumption per unit of gross domestic product (GDP): 2.76 kg/USD (33)
At least 7% (33)
N/A
14.4.1 Proportion of fish stocks within biologically sustainable levels
N/A
N/A
Secondary SDGs addressed
Directly impacted stakeholders
People
Gender inequality and/or marginalization
Planet
Corporates
Indirectly impacted stakeholders
People
Corporates
Outcome Risks
Aquaculture may generate significant amounts of waste/effluents, leading to undesirable environmental consequences such as eutrophication or nitrification.(19)
Inland aquaculture may be responsible for the deterioration of water bodies used for human consumption.(20)
Construction of aquaculture farms affects natural ecosystems, in particular mangrove forests (deforestation).(20)
Displacement of native species (competition for space and food with newly introduced species) (20)
Gender inequality and/or marginalization risk: Any negative environmental outcome will predominantly impact the main source of income for women and rural households, that is farming lands.
Impact Risks
Unexpected impact risk: There might be an unexpected negative or positive impact on aquaculture and marine ecosystems, affecting the livelihood of fishers and fisheries.
Gender inequality and/or marginalization risk: Stakeholder participation risk; women provide the majority of the farming workforce, so their expectations need to be considered.
Impact Classification
What
Investing in sustainable aquaculture and fish breeding is likely to have positive impact because it increases food availability and protein intake, and can contribute to limiting overfishing.
Who
Undernourished people and children as well as fish producers and processors who are aggrieved due to lack of fish to eat (as a source of protein) or process.
Risk
Although the model is market proven, the sector has limited regulations and incentives for guidance. There is also insufficient managerial skills to deal with location-specific challenges.
Impact Thesis
Contribute to food security in Kenya, increase protein intake and reduce malnutrition in the general population and stunting in children.
Enabling Environment
Policy Environment
Third Medium Term Plan of 2018-2022: According to this plan, the government wants to increase fish production to 304,000 metric tons annually by 2022 (13), develop fishery infrastructure, acquire aquaculture technology and construct fish laboratories.(22)
Aquaculture Business Development Programme: Under this agreement between the government and the International Fund for Agricultural Development (IFAD), the government plans to increase fish consumption to 10 kg/year (African average). The program is valued at USD 143 million.(18)
Agricultural Sector and Transformation Strategy: Anchor 1 of this strategy aims to increase the incomes of farmers and fisherfolk by around 40%.(23)
Financial Environment
Financial incentives: Kenya has a 150% investment allowance on the cost of buildings and machinery installed for investments worth USD 2 million (KSH 200 million) situated outside Nairobi, Mombasa, Kisumu.(28)
Fiscal incentives: Because fish feed accounts for over 50% of operating cost, the government introduced regulations to control its quality to limit losses to fish producers. The government also provides zero-rate value added tax (VAT) for animal feed and imported materials for feed production.(29)
Other incentives: The Aquaculture Business Development Programme by the International Fund for Agricultural Development (IFAD) will contribute to the development of value chains, scaling up public-private-producer partnerships (PPPPs), and provide necessary training and advisory services. The programme is valued at a cost of USD 143 million.(30)
Regulatory Environment
Fishery Act (Chapter 378): This Act is the main legislation governing fishing and aquaculture. It regulates overall fishing and fish resources protection, and transfers of fish between catchments. However, it is very general and not-aquaculture specific. (24)
Fisheries Management And Development Act No. 35: This Act provides a separate section for aquaculture where e.g. it establishes the requirements for aquaculture development plans.(25)
Fish, Fishery Products and Fish Feed Safety And Quality Regulations 2019: The government introduced these regulations that specify the minimal quality of feed and aquaculture. The regulations were in response to the challenge of low-quality feeding material.(26)
The State Department for Fisheries, Aquaculture and the Blue Economy (part of the Ministry of Agriculture, Livestock and Fisheries) is the head authority regulating fish policy.(27)
Marketplace Participants
Private Sector
Brinkley Limited, Crustacean Processors, Kiboma Seafoods, Lakevic Food Supplies Limited, Peche Foods Limited, Pwani Sealife Kenya Ltd, Scanfish TR, Transvic Seafoods Ltd, Victolapia Investments, Victory Farms
Government
State Department for Fisheries, Aquaculture and the Blue Economy (part of the Ministry of Agriculture, Livestock and Fisheries)
Multilaterals
United Nations Economic Commission for Africa (UNECA), International Fund for Agricultural Development (IFAD), DOB Equity, VestedWorld, Conservation International Ventures
Non-Profit
Aquaculture Business Development Programme, Kenya Marine and Fisheries Research Institute, The Aquaculture Association of Kenya, Kenya Fisheries Advisory Council
Target Locations

Kenya: Central
Kenya: Western
Kenya: Nyanza
Kenya: Eastern
References
- (1) World Bank (2020). Kenya Economic Update: Turbulent Times for Growth in Kenya.
- (2) World Bank database, 2020. https://data.worldbank.org/
- (3) ISIC Classification Revision. Comparative Industry Forecast Tables - Agriculture.
- (4) World Bank (2019). Unbundling the Slack in Private Sector Investment: Transforming Agriculture Sector Productivity and Linkages to Poverty Reduction. April 2019 | Edition No. 19.
- (5) Sachs, J., Schmidt-Traub, G., Kroll, C., Lafortune, G., Fuller, G., Woelm, F. (2020). The Sustainable Development Goals and COVID-19. Sustainable Development Report 2020. Cambridge: Cambridge University Press.
- (6) Ministry of Agriculture (2019). Agricultural Sector Transformation and Growth Strategy: Towards Sustainable Agricultural Transformation and Food Security in Kenya 2019-2029.
- (7) Government of Kenya. National Agriculture Investment Plan (NAIP) 2019-2024. http://extwprlegs1.fao.org/docs/pdf/ken189052.pdf
- (8) World Bank (2020). Kenya Economic Update: Turbulent Times for Growth in Kenya,
- (9) Food and Agriculture Organization of the United Nations. Agriculture Policies Database for Kenya.
- (10) Opiyo,M.A., Marijani, E., Muendo, P., Odede, R., Leschen, W. and Charo-Karisa, H. (2018). 'A review of aquaculture production and health management practices of farmed fish in Kenya', International Journal of Veterinary Science and Medicine. https://www.tandfonline.com/doi/pdf/10.1016/j.ijvsm.2018.07.001?needAccess=true
- (11) Food and Agriculture Organization of the United Nations. National Aquaculture Sector Overview - Kenya. http://www.fao.org/fishery/countrysector/naso_kenya/en
- (12) Food and Agriculture Organization of the United Nations. Fishery and Aquaculture Country Profiles - The Republic of Kenya. http://www.fao.org/fishery/facp/KEN/en
- (13) Wambua, M.M. (2015). A Cost–Benefit Analysis of the Fish Farming Enterprise Productivity Program Project in Kenya. The Case of Implementation of the Aquaculture Development Component in Meru County. United Nations University. https://www.grocentre.is/static/gro/publication/351/document/moses15prf.pdf
- (14) Salia, A.M.J. (2008). Economic analysis of small-scale tilapia aquaculture in Mozambique. Institute Nacional de Desenvolvimento de Aquaculture. https://www.yumpu.com/en/document/read/36178964/economic-analysis-of-small-scale-tilapia-aquaculture-in-mozambique
- (15) Namonje-Kapembwa, T. and Samboko, P. (2020). 'Is aquaculture production by small-scale farmers profitable in Zambia?', Indaba Agricultural Policy Research Institute. https://academicjournals.org/journal/IJFA/article-full-text-pdf/556442662883
- (16) Jamu, D. and Brummett, R. (2004). Use of genetically improved and alien species for aquaculture and conservation of aquatic biodiversity in Africa.
- (17) Barange, M. (2018). Aquaculture Opportunities And Challenges In Africa. Nairobi: FAO. http://www.fao.org/fi/static-media/MeetingDocuments/SustainableBlueEconomy/FAO%20co-hosted%20side%20event%20on%20aquaculture/2.pdf
- (18) Obiero, K., Cai, J., Abila, R. and Ajayi, O. (2019). High aquaculture growth needed to improve food security and nutrition. https://www.afipek.org/a-policy-brief-on-kenya-high-aquaculture-growth-needed-to-improve-food-security-and-nutrition/#
- (19) Serpa, D. and Duarte, P. (2017). Impacts of Aquaculture and Mitigation Measures. Global Science Books. http://www.globalsciencebooks.info/Online/GSBOnline/images/0812/DBPBMB_2(SI1)/DBPBMB_2(SI1)1-20o.pdf
- (20) Martinez-Porchas, M. and Martinez-Cordova, L. (2012). 'World Aquaculture: Environmental Impacts and Troubleshooting Alternatives'. Scientific World Journal. https://www.ncbi.nlm.nih.gov/pmc/articles/PMC3353277/
- (22) Republic of Kenya (2018). Third Medium Term Plan 2018 – 2022: Transforming Lives: Advancing Socio-economic Development Through The 'Big Four'.
- (23) Ministry of Agriculture (2019). Agricultural Sector Transformation and Growth Strategy: Towards Sustainable Agricultural Transformation and Food Security in Kenya 2019-2029.
- (24) Fisheries Act 2012 (Chapter 378). http://extwprlegs1.fao.org/docs/pdf/ken3536.pdf
- (25) Fisheries Management And Development Act No. 35 of 2016. http://extwprlegs1.fao.org/docs/pdf/ken160880.pdf
- (26) Fish, Fishery Products and Fish Feed Safety And Quality Regulations 2019. https://www.kilimo.go.ke/wp-content/uploads/2019/06/Revised-FIQA-Regulations-15-18th-April-2019-workshop-Lukenya.pdf
- (27) Ministry of Agriculture, Livestock and Fisheries website. https://www.kilimo.go.ke/management/state-department-of-livestock-2/
- (28) KENIvest. Investment Incentives. http://www.invest.go.ke/starting-a-business-in-kenya/investment-incentives/
- (29) Obwanga, B. and Lewo, M.R. (2017). 'From aid to responsible trade: driving competitive aquaculture sector development in Kenya'. Wageningen University and Research. https://www.3r-kenya.org/wp-content/uploads/2017/09/3R-Aquaculture-Quick-Scan-2017.pdf
- (30) Ministry of Agriculture, Livestock and Fisheries and International Fund for Agriculture Development (2020). Aquaculture Business Development Programme. https://www.kilimo.go.ke/wp-content/uploads/2020/03/ToRs-Aquaculture-Business-Development-Advisor_Feb2020.pdf
- (31) The Sustainable Trade Initiative (2020). https://www.idhsustainabletrade.com/news/tilapia-farming-in-kenya-and-tanzania-can-be-profitable/
- (32) Deutsche Welle (2013). Women take over Kenya's farming sector. https://www.dw.com/en/women-take-over-kenyas-farming-sector/a-16716322
- (33) SDG Tracker (2021). End poverty in all its forms everywhere. https://sdg-tracker.org/no-poverty