Solid and E-Waste Management
Business Model Description
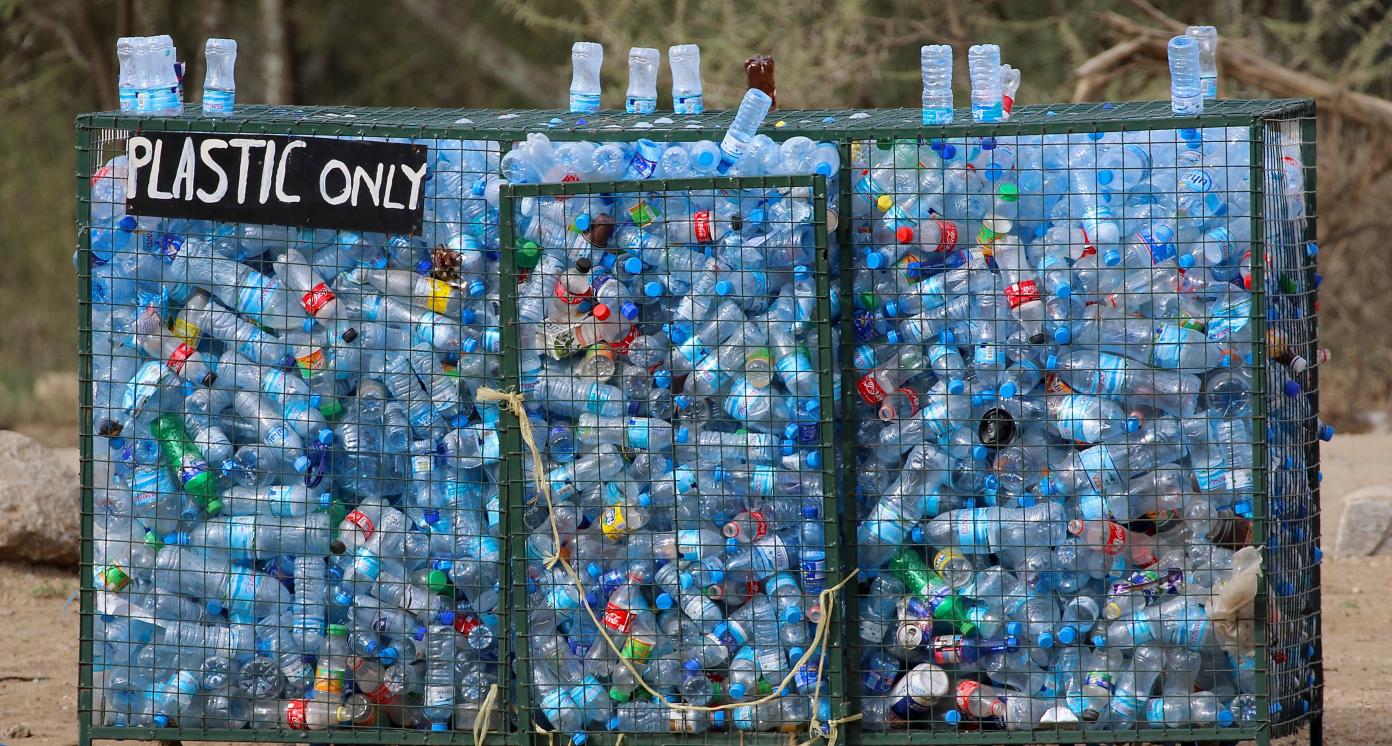
Develop and operate commercial dumpsites for the collection, storage and utilization of solid and e-waste from residential, commercial and industrial sources utilizing modern equipment, such as self-loading trucks, mixers and sorters, through a public-private partnership model. Recycling activities accompany waste disposal processes with possibility of biogas or energy production. The public actor invests in infrastructure, such as land, systems and logistics for collection, as well as sorting and recycling the waste. The private actor builds, operates and manages recycling plants and systems for reuse, making a profit from the provision of service and sale of recycled and reused material.
Expected Impact
Minimize health hazards associated with uncollected waste and move towards a circular economy with efficient and sustainable resource use.
How is this information gathered?
Investment opportunities with potential to contribute to sustainable development are based on country-level SDG Investor Maps.
Disclaimer
UNDP, the Private Finance for the SDGs, and their affiliates (collectively “UNDP”) do not seek or solicit investment for programmes, projects, or opportunities described on this site (collectively “Programmes”) or any other Programmes, and nothing on this page should constitute a solicitation for investment. The actors listed on this site are not partners of UNDP, and their inclusion should not be construed as an endorsement or recommendation by UNDP for any relationship or investment.
The descriptions on this page are provided for informational purposes only. Only companies and enterprises that appear under the case study tab have been validated and vetted through UNDP programmes such as the Growth Stage Impact Ventures (GSIV), Business Call to Action (BCtA), or through other UN agencies. Even then, under no circumstances should their appearance on this website be construed as an endorsement for any relationship or investment. UNDP assumes no liability for investment losses directly or indirectly resulting from recommendations made, implied, or inferred by its research. Likewise, UNDP assumes no claim to investment gains directly or indirectly resulting from trading profits, investment management, or advisory fees obtained by following investment recommendations made, implied, or inferred by its research.
Investment involves risk, and all investments should be made with the supervision of a professional investment manager or advisor. The materials on the website are not an offer to sell or a solicitation of an offer to buy any investment, security, or commodity, nor shall any security be offered or sold to any person, in any jurisdiction in which such offer would be unlawful under the securities laws of such jurisdiction.
Case Studies
Country & Regions
- Tanzania: Countrywide
- Tanzania: Eastern Zone
- Tanzania: Northern Zone
- Tanzania: Lake Zone
- Tanzania: Southern Highlands Zone
Sector Classification
Infrastructure
Development need
Infrastructure is both a facilitator for development and an attractive investment channel. However, the sector is faced with persistent structural challenges, including a heavy dominance of inefficient parastatals in infrastructure provision, accompanied by a poor track record for privatization and private involvement in utilities in the past (1).
Policy priority
The government is committed to develop quality and reliable infrastructure that promotes socio-economic development of Tanzania. Particular emphasis is placed on the provision of quality and safe construction works of roads, bridges, ferries, airports, buildings, mechanical, electrical and electronics in collaboration with private stakeholders (2).
Gender inequalities and marginalization issues
Despite legal protection granted by laws and enforcement mechanisms, discrimination against women in accessing infrastructure and especially land persists in Tanzania. It emanates from the frequent application of customary laws, and an unfamiliarity with formal laws among local leaders and authorities (3).
Investment opportunities introduction
Tanzania's strong growth in real GDP from 4.1% in 2021 and 5.8% in 2022 is expected to promote significant development in infrastructure needs, including human settlement and particularly modern housing facilities as well as waste and agricultural storage solutions (4, 5).
Key bottlenecks introduction
The growth rate of urban areas in Tanzania has often been higher than the capacity of authorities to cope with the provision of basic services, including delivery of planned, surveyed and serviced land for housing development as well as waste management and horticulture infrastructure (6).
Waste Management
Development need
The management of solid waste generated in urban centres of Tanzania is a serious challenge for local government authorities. The situation in major cities, particularly Dar es Salaam, is of particular concern because of a rapidly growing population and urbanization without adequate waste management systems (7, 8).
Policy priority
The government is committed to promote efficient and environmental friendly waste management systems, efficient technologies for solid waste management, solid waste collection and transportation systems and seeks to strengthen public-private partnerships in solid waste disposal undertakings (7, 8, 9).
Gender inequalities and marginalization issues
Whilst there is evidence of a traditional gendered division of labour in waste management as a major informal economy activity, the subsector has not only offered women employment, but also enabled women to become more empowered through increasing their income and developing meaningful civic activities (11).
Investment opportunities introduction
Waste management opportunities include development of a full cost recovery waste fee system, improvement of waste logistics including low cost transfer stations, separation of organic waste to composting and fertilizer generation, recycling activities for biogas and energy production, as well as collection, mixing and sorting equipment and waste storage structures (7, 8, 9, 10).
Key bottlenecks introduction
Challenges in waste management include improper payment of the refuse collection and institutional structures, low levels of law enforcement and lack of coordination with other departments or sectors; political interferences by ward and street officials, and insufficient budget for operations and maintenance (7).
Waste Management
Pipeline Opportunity
Solid and E-Waste Management
Develop and operate commercial dumpsites for the collection, storage and utilization of solid and e-waste from residential, commercial and industrial sources utilizing modern equipment, such as self-loading trucks, mixers and sorters, through a public-private partnership model. Recycling activities accompany waste disposal processes with possibility of biogas or energy production. The public actor invests in infrastructure, such as land, systems and logistics for collection, as well as sorting and recycling the waste. The private actor builds, operates and manages recycling plants and systems for reuse, making a profit from the provision of service and sale of recycled and reused material.
Business Case
Market Size and Environment
< USD 50 million
Tanzania has a total estimated waste recycling investment potential amounting to USD 8,300,000. This is split between plastics (USD 2 million), paper products (USD 2 million), e-waste (USD 1 million), used oil (USD 3 million) and lead from used batteries (USD 300,000) (9).
The city of Dar es Salaam generates about 4,252 tons of solid waste per day. The collection capacity is around 58%. This results in a remaining potential is around 1,779 tons per day. The current solid waste generation rate of 1 kg/day per household is higher than typical values for developing countries, which range from 0.4-0.6 kg/day per household (8, 9).
Indicative Return
20% - 25%
Cost benefit analyses of four solid waste management options conducted in Morogoro Municipality suggest that both recycling and composting are profitable given positive net present values of TZS 13.1 million (5,600 USD) and 2.3 million (1,000 USD) respectively. This approximates to an IRR of over 20% (14).
Investment Timeframe
Short Term (0–5 years)
An economic analysis of solid waste management options in Morogoro Municipality suggests an investment timeframe of three years under the assumption that at year 3 the benefits or outputs and cost of the management options can easily be tracked, such as for biogas, compost manure and recycled products (3).
Ticket Size
USD 1 million - USD 10 million
Market Risks & Scale Obstacles
Business - Supply Chain Constraints
Market - High Level of Competition
Capital - Requires Subsidy
Impact Case
Sustainable Development Need
Tanzania's major cities produce 4.6 million tons of solid waste per year, out of which only 52%, equivalent to 2.4 million tons, is collected. The uncollected waste causes eruptive health hazards, proliferation of diseases, environmental degradation and depletion of authorised land fill sites (19).
Around 7%, equivalent to 322,000 tons, of solid wastes are e-waste. These are emerging wastes as a result of the use of electronic and electrical equipment. The uncollected e-waste adds to the challenge of environmental pollution (19).
Gender & Marginalisation
Managing solid waste at the household level tends to be a woman’s burden, and can be hazardous and time-consuming. The lack of organised collection services means that women have to spend time burying organic waste and burning non-organic waste (20).
The waste management problem is more pronounced among the poor and marginalized group of the population, particularly the squatter settlements, where 70-80% of the urban population resides without the necessary infrastructure and social services. Consequently, over 70% of diseases in these areas are water and sanitation related (8, 15, 19).
Expected Development Outcome
Efficient and sustainable solid and e-waste management leads to improved human health, particularly in reducing the incidences of eruptive diseases and environmental degradation (9, 19, 20).
Efficient and sustainable e-waste management leads to a reduction in environmental pollution through application of solutions, such as recycling (19).
Gender & Marginalisation
Solid and e-waste management offers employment opportunities for low-skilled workers and women through various activities in the value chain, including in collection, recycling plants and waste disposal (11).
Primary SDGs addressed

11.6.1 Proportion of municipal solid waste collected and managed in controlled facilities out of total municipal waste generated, by cities
24 towns have up-to-date general planning schemes, including waste disposal schemes in 2020/2021 (5).
An increase to 54 towns and urban centres with up-to-date general planning schemes, including waste disposal schemes, by 2025/2026 (5).

12.4.2 (a) Hazardous waste generated per capita; and (b) proportion of hazardous waste treated, by type of treatment
Hazardous solid waste per inhabitant currently estimated at 0.00114 kg / cap / day (31).
N/A

6.2.1 Proportion of population using (a) safely managed sanitation services and (b) a hand-washing facility with soap and water
6.3.1 Proportion of domestic and industrial wastewater flows safely treated
13% of households connected to convention public sewer systems in Regional Centres in 2020/21 (5).
Proportion of domestic and industrial wastewater flows safely treated currently estimated at 5.5% (32).
30% of households connected to convention public sewer systems in Regional Centre in 2025/25 (5).
Proportion of domestic and industrial wastewater flows safely treated projected at 80% in 2025 (32).
Secondary SDGs addressed


Directly impacted stakeholders
People
Gender inequality and/or marginalization
Planet
Corporates
Public sector
Indirectly impacted stakeholders
Gender inequality and/or marginalization
Corporates
Outcome Risks
If managed improperly, the solid waste may pose a threat to the environment and the health of waste management workers (19). The effects of e-waste to human health and wellbeing includes respiratory problems, oxidative stress, DNA damage and the possibility of causing cancer. This is chiefly due to their chemical and physical characteristics, which sets them apart from other forms of wastes that are produced by human activities or industrial wastes (35).
Impact Risks
Poor participation of targeted communities, especially low-income earners due to fee barriers, alongside suboptimal distribution and logistics infrastructure, may limit the expected impact especially in informal settlements (10, 16, 19).
The local government's reluctance to mobilize communities in domestic waste collection may limit the expected impact. People are not adhering to regulations including by-laws because of poor enforcement system by local governments. Sometimes local authorities do not take actions to residents found disposing waste haphazardly. There are also incidences of political interferences in some areas, which prohibit the refuse charged by the wards and street offices (18).
Failure of the government and the municipal authorities to honour their obligation to provide adequate resources may limit the effectiveness of waste management. Government reluctance to provide necessary subsidy for recovering the cost-of-service delivery occasioned by the poor communities’ ability to pay for services may further compound the problem (9, 10, 16).
Impact Classification
What
Solid and e-waste management minimizes health hazards associated with uncollected refuse, creates a clean environment and offers income generation opportunities for urban communities.
Who
Low-income communities in urban and congested areas and those working in the informal sector as well as the environment benefit from solid and e-waste management.
Risk
While the solid and e-waste management model is proven, lack of adequate resources for cost-of-service recovery and reluctance of local government to mobilize communities requires consideration.
Impact Thesis
Minimize health hazards associated with uncollected waste and move towards a circular economy with efficient and sustainable resource use.
Enabling Environment
Policy Environment
National Solid Waste Management Strategy, 2018: Aims at attaining sustainable management of solid waste that contributes to achieving economic and social benefits to Tanzanian people. It has been developed to enable the country meet the goals for solid waste management (9).
National Environment Policy, 1997: Outlines government commitment to promote environmental sound practices to address the challenges related to land degradation; lack of accessible, good quality water for both urban and rural inhabitants, and environmental pollution (39).
National Five-Year Development Plan, 2021 (FYDP III): Outlines the importance of environment and natural resources as national assets that must be protected. It identifies interventions to strengthen the systems of environmental protection and sustainable use of natural resources for the benefit of present and future generations. Other areas of focus include ensuring safe use and handling of modern technologies, including those for handling solid and e-waste (5).
National Environmental Action Plan (NEAP), 2013-2018: Acknowledges that increasing urbanization, rising standards of living and rapid development associated with population growth have resulted in increased solid and liquid waste generation (55).
Financial Environment
Fiscal incentives: Tanzania offers import duty and VAT exemption on deemed capital goods, including building materials, utility vehicles and equipment that is required for solid and e-waste management, among other things (29, 30).
Fiscal incentives: The income tax laws allow 50% capital allowances in the first year of use for plant and machinery, which applies for solid waste management tools and machinery for solid collection, transportation and treatment, including recycling (29, 30).
Other incentives: The government may identify projects and grant special strategic investment status if the investment capital transaction is undertaken through registered local financial and insurance institutions. This applies to solid and e-waste management (29, 30).
Regulatory Environment
Environmental Management (Solid Waste) Regulations, 2009: Highlights waste minimization and cleaner production principles alongside the duty to safeguard the public health and the environment from adverse effects of solid waste (25).
Environmental Management (Soil Quality Standards) Regulations, 2007: Comprises of hazardous waste management; registration and discharge permit for polluting activities. The regulation stipulates procedures for private sector entity to get a license for waste management (26).
Environmental Management (Hazardous Waste Control and Management) Regulations, 2009: Details the requirements and responsibilities for controlling and managing hazardous waste in Tanzania (27).
Tanzania Investment Act, No. 26, 1997: Established the Tanzania Investment Centre (TIC) to promote, coordinate and facilitate investment into Tanzania, and governs investment activities. This act is relevant for private investors intending to become active in waste management (54).
Marketplace Participants
Private Sector
The Recycler Ltd, Arena Recycling Industry, GreenWaste Prohouse Ltd, Oswams Waste Management Systems Ltd.
Government
Ministry of Lands and Human Settlements, Vice presidents Office, Local Government Authorities (LGAs), Tanzania Investment Centre (TIC), Tanzania Environmental Management Council (NEMC), Tanzania Bureau of Standards (TBS).
Multilaterals
World Bank Group (WBG).
Non-Profit
United Kingdom’s Foreign, Commonwealth and Development Office (FCDO), Habitat International, SNV Netherlands Development Organization, Habitat International, Environmental Engineering and Pollution Control Organization (EEPCO), Sustainability in Action (SiA), WasteAid.
Public-Private Partnership
The proposed USD 14 million Tanzania Public-Private Partnership Project (TPPP) financed by the World Bank (WB) will assist Ministries, Departments and Agencies (MDAs) and local government authorities (LGAs), including for waste management infrastructure.
Target Locations
Tanzania: Countrywide
Tanzania: Eastern Zone
Tanzania: Northern Zone
Tanzania: Lake Zone
Tanzania: Southern Highlands Zone
References
- (1) TanzaniaInvest.com, 2022. https://www.tanzaniainvest.com/construction/realestate.
- (2) United Republic of Tanzania, 2020. Ministry of Works and Transport Strategic Plan, 2021/22 – 2025/26.
- (3) Kerbina Joseph Moyo, 2017. Women’s Access to Land in Tanzania. The Case of the Makete District, Royal Institute of Technology (KTH) Stockholm.
- (4) African Development Bank, 2021. Tanzania Economic Outlook.
- (5) African Development Bank, 2021. Tanzania Economic Outlook.
- (6) International Journal of Social Science Studies 2018, Vol. 6, No. 12.
- (7) Environmental Resource Consultancy (ERC), 2016. Solid Waste Management in Urban Centers of Tanzania, Leapfrogging Towards a Circular Economy.
- (8) International Journal of Environmental Research and Public Health, 2019. Analyzing Municipal Solid Waste Treatment Scenarios in Rapidly Urbanizing Cities in Developing Countries: The Case of Dar es Salaam, Tanzania.
- (9) United Republic of Tanzania, 2018. The National Solid Waste Management Strategy.
- (10) European Sustainable Solutions, 2016. Expert Mission on Integrated Solid Waste Management (ISWM) to Dar es Salaam.
- (11) International Journal of Health Promotion and Education, 2004. Sweeping is women's work: Employment and empowerment opportunities for women through engagement in solid waste management in Tanzania and Zambia.
- (12) Arena, 2022. http://www.arena.co.tz.
- (13) Zaidi, 2022. https://www.zaidi.co.tz.
- (14) Journal of Environmental Protection, 2014. Critical Analysis of the Challenges of Solid Waste Management Initiatives in Keko Machungwa Informal Settlement, Dar es Salaam.
- (15) Habitat International, 2005. Appraisal of Solid Waste Collection Following Private Sector Involvement in Dar es Salaam City, Tanzania.
- (16) Sokoine University of Agriculture, 2016. Economic Analysis of Solid Waste Management Options in Morogoro Municipality, Tanzania.
- (17) Habitat International, 2005. Appraisal of Solid Waste Collection Following Private Sector Involvement in Dar es Salaam City, Tanzania.
- (18) The Recycler Limited, 2022. Company Profile. https://www.recycler.co.tz.
- (19) Amir Kingu et al, 2016. Solid Waste Management in Urban Centers of Tanzania, Leapfrogging Towards a Circular Economy.
- (20) SNV Netherlands Development Organization, 2020. Solid waste management systems reform in Dar es Salaam’s low-income areas.
- (21) United Republic of Tanzania, 2005. National Human Settlement Development Policy.
- (22) United Republic of Tanzania, 1997. National Land Policy.
- (23) United Republic of Tanzania, 2016. The National Land Policy.
- (24) United Republic of Tanzania, 2006. The revised National Population Policy.
- (25) United Republic of Tanzania, 2009. Environmental Management (Solid Waste) Regulations.
- (26) United Republic of Tanzania, 2007. Environmental Management (Soil Quality Standards) Regulations.
- (27) United Republic of Tanzania, 2009. Environmental Management (Hazardous Waste Control and Management) Regulations.
- (28) World Bank, 2022. Tanzania Urban Resilience Program. https://www.worldbank.org/en/programs/tanzania-urban-resilience-program.
- (29) Tanzania Investment Center (TIC), 2022. https://www.tic.go.tz.
- (30) EAC, 2022. Investment Guide. https://investment-guide.eac.int.
- (31) United Republic of Tanzania, 2019. National E-Waste Statistics Report.
- (32) United Nations Statistics Division, 2020.
- (33) World Health Organization, 2021. Country files for SDG 6.3.1: "Proportion of wastewater safely treated".
- (34) The Open University of Tanzania, 2012. Dar es Salaam City and Challenges in Solid Waste Management. The Case of Manzese and Sinza Wards.
- (35) Nelson Mandela African Institute of Science and Technology, 2017. Management of Medical Wastes: Public Awareness and Associated Health Risks.
- (36) IntechOpen, 2011. E-Waste Disposal Challenges and Remedies: A Tanzanian Perspective.
- (37) United Republic of Tanzania, 1997. Tanzania Investment Act, No. 26.
- (38) United Republic of Tanzania, 2013. National Environmental Action Plan.
- (39) United Republic of Tanzania, National Environmental Action Plan (NEAP) 2013 – 2018.
- (40) Macro Trends, 2022. https://www.macrotrends.net/cities/22894/dar-es-salaam/population.

