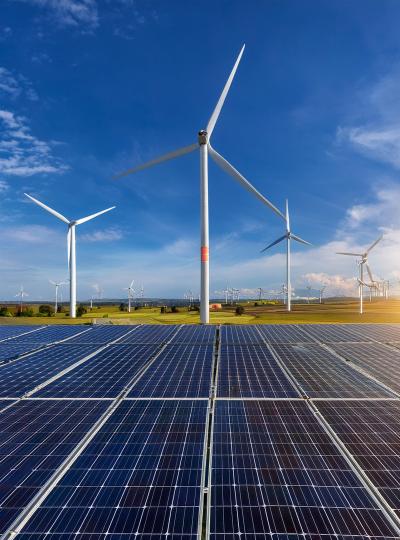
Solar PV and Rooftop Solar Power systems
Business Model Description
Invest in or provide project financing for electricity generation for industrial (manufacturing units or plants) and commercial (office buildings) and residential energy needs through: > Solar PV systems under independent power producer (IPP) schemes or public-private partnership (PPP); and > Roof-top systems under private commercial investment.
Examples of some companies active in this space are: SolarKita, founded in 2018, is a Smart Solar Energy Company that provides solar products and end-to-end services to the residential market in Indonesia, consultation, site survey, installation, and monitoring & maintenance. It raised an undisclosed amount of funding from New Energy Nexus.
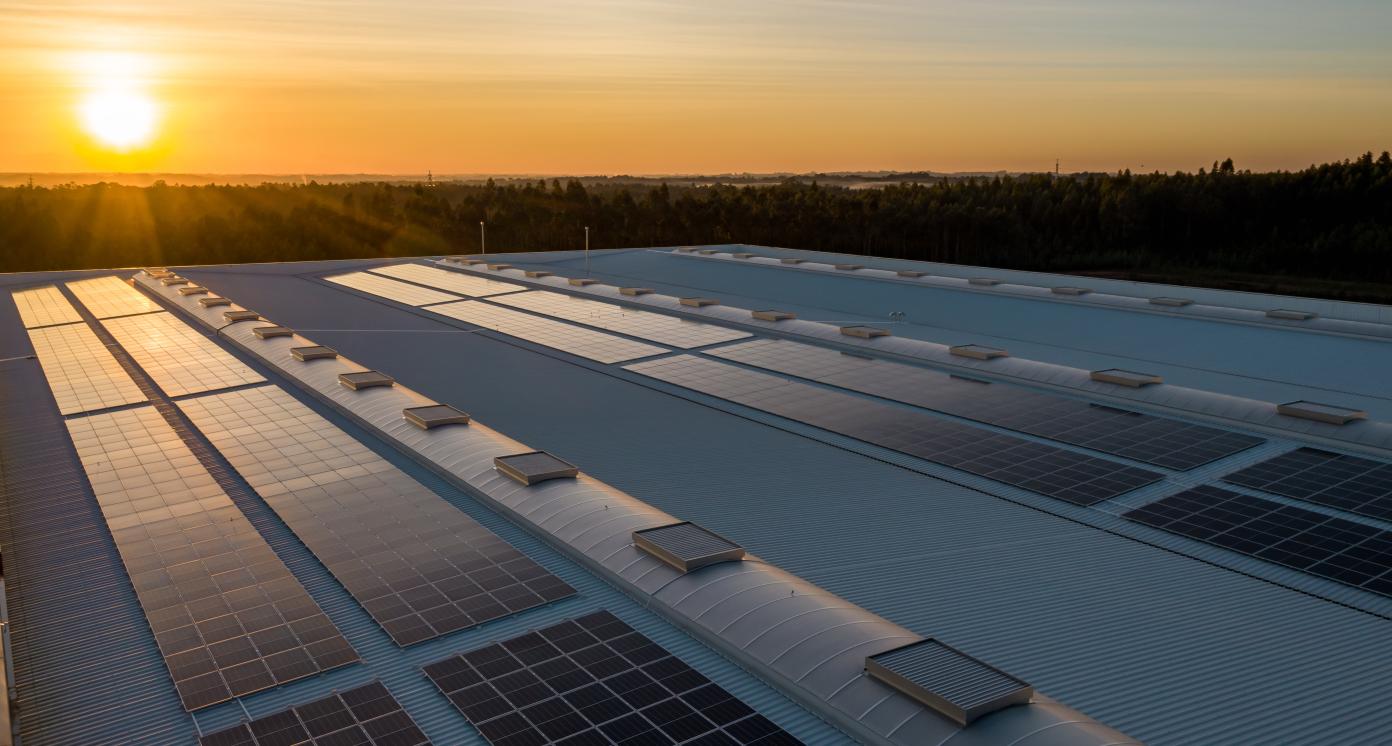
PT Xurya Daya Indonesia, founded in 2018, installs and leases rooftop solar panels. The company provides rooftop solar power plants (PLTS) that generate electricity. It also provides operation and maintenance services for solar panels. In 2022, it raised USD 21.5 mn in series A from East Ventures (Growth fund) and PT Saratoga Investama Sedaya Tbk. (Saratoga). (14)
PACE Energy, founded in 2015, is a wholly-owned subsidiary of Total Eren S.A. a leading French renewable energy Independent Power Producer (IPP) with over 27,500 MW of assets in construction or operations.
Expected Impact
Solar-based electricity generation to serve household, commercial and industrial needs and increase the proportion of RE in the total energy mix.
How is this information gathered?
Investment opportunities with potential to contribute to sustainable development are based on country-level SDG Investor Maps.
Disclaimer
UNDP, the Private Finance for the SDGs, and their affiliates (collectively “UNDP”) do not seek or solicit investment for programmes, projects, or opportunities described on this site (collectively “Programmes”) or any other Programmes, and nothing on this page should constitute a solicitation for investment. The actors listed on this site are not partners of UNDP, and their inclusion should not be construed as an endorsement or recommendation by UNDP for any relationship or investment.
The descriptions on this page are provided for informational purposes only. Only companies and enterprises that appear under the case study tab have been validated and vetted through UNDP programmes such as the Growth Stage Impact Ventures (GSIV), Business Call to Action (BCtA), or through other UN agencies. Even then, under no circumstances should their appearance on this website be construed as an endorsement for any relationship or investment. UNDP assumes no liability for investment losses directly or indirectly resulting from recommendations made, implied, or inferred by its research. Likewise, UNDP assumes no claim to investment gains directly or indirectly resulting from trading profits, investment management, or advisory fees obtained by following investment recommendations made, implied, or inferred by its research.
Investment involves risk, and all investments should be made with the supervision of a professional investment manager or advisor. The materials on the website are not an offer to sell or a solicitation of an offer to buy any investment, security, or commodity, nor shall any security be offered or sold to any person, in any jurisdiction in which such offer would be unlawful under the securities laws of such jurisdiction.
Country & Regions
- Indonesia: Kalimantan
- Indonesia: Java
- Indonesia: Sumatra
Sector Classification
Renewable Resources and Alternative Energy
Development need
The use of new renewable energy (NRE) has increased, but not realized for its full potential. (1) The energy mix for NRE is ~11%, still lower than 2025 target of 23%. (2) GoI pledged to reduce emissions during 2020-2030 by 29% (unconditional) upto 41% (conditional) against the 2030 business as usual scenario. (3)
Policy
Presidential Regulation no.18/2020 - NRE is prioritized to fulfill energy demand. Improving Environment, Increasing Disaster and Climate Change Resilience, including energy policy, is designated as one of the national priorities (PN6).(1.2)
Under COP26, Indonesia pledged to commit:
2030: >50% new electricity capacity from RE
2040: partial coal phase-out
2060: achieve a net-zero target (6).
Gender inequalities and marginalization issues
In 2021, ~12.5 mn poor and vulnerable households, mostly in rural areas, still use firewood for cooking. (7)
Clean energy could offer low-income communities, including women, an alternative to their daily use of traditional wood-fired stoves, which have been categorized as unclean, inefficient and unhealthy.
At the micro/household level, women play an important role in energy efficiency efforts, such as electricity-saving or water usage. The energy and RE sector could reap significant benefits from the value-add of women across levels (including entrepreneurs, RE consumers, or decision-making).
The Ministry of Energy and Mineral Resources (MEMR) has sought efforts to mainstream gender in the RE sector and observed an increase in women employment from 22.8% in 2011 to 27.5% in 2021. (8)
Investment opportunities introduction
Indonesia's total power investment needs are estimated at USD 9.14 bn annually over 2021-30, or 1.6x the actual spending power in 2019 to meet its net-zero target. With PLN expected to contribute USD 5.14 bn/year for such needs, private sector participation is encouraged to ease financial burdens and tap into opportunities to strengthen the RE sector. (9)
Key bottlenecks introduction
The absence of established guidelines and enforcements for clean energy, including incentives and disincentives and minimum performance standards, leads to a lack of verification of savings, demand policies for change, risk reduction and capacity gap for market entry for renewable energy players. (10)
Alternative Energy
Development need
Electricity supply from the State Electricity Company (PLN) is still generated mostly from coal. PLN projects the energy demand to rise to 1,800 terawatt-hour by 2060 leaving a gap of 1,380 terawatt-hour. (11) The 2021-2030 RUPTL has targeted 20.9 GW electricity generation using NRE (9)
Policy
Sustainable, adequate, accessible, and affordable energy and electricity are among priorities to achieve 2020-2024 development agenda in energy sector. These are accommodated in the Priority Program (PP) 1 - NRE acceleration to meet energy needs and PP 2 - Efficient, equally distributed and reliable energy supply. (5)
Gender inequalities and marginalization issues
In 2020, there are 409 villages without electricity and 3,090 others without sufficient and reliable electricity. The villages are mostly located in eastern part of Indonesia such as Papua and NTT. (12)
Investment opportunities introduction
Electricity consumption per capita grew from 1.06 MWH (2018) to 1.09 MWH (2020), indicating a growing domestic demand (13) and need to fulfill it through alternative means. 65% of additional capacity for power generation expansion plans is allocated to Independent Power Producers (IPP) (not PLN) to encourage private players to invest in renewable energy. (9)
Key bottlenecks introduction
Investment cost for NRE power plants is still higher than that for fossil fuel, while the demand for electricity remains uncertain in some regions due to several problems such as industrial production capacity. (9)
Solar Technology and Project Developers
Pipeline Opportunity
Solar PV and Rooftop Solar Power systems
Invest in or provide project financing for electricity generation for industrial (manufacturing units or plants) and commercial (office buildings) and residential energy needs through: > Solar PV systems under independent power producer (IPP) schemes or public-private partnership (PPP); and > Roof-top systems under private commercial investment.
Examples of some companies active in this space are: SolarKita, founded in 2018, is a Smart Solar Energy Company that provides solar products and end-to-end services to the residential market in Indonesia, consultation, site survey, installation, and monitoring & maintenance. It raised an undisclosed amount of funding from New Energy Nexus.
PT Xurya Daya Indonesia, founded in 2018, installs and leases rooftop solar panels. The company provides rooftop solar power plants (PLTS) that generate electricity. It also provides operation and maintenance services for solar panels. In 2022, it raised USD 21.5 mn in series A from East Ventures (Growth fund) and PT Saratoga Investama Sedaya Tbk. (Saratoga). (14)
PACE Energy, founded in 2015, is a wholly-owned subsidiary of Total Eren S.A. a leading French renewable energy Independent Power Producer (IPP) with over 27,500 MW of assets in construction or operations.
Business Case
Market Size and Environment
USD 100 million - USD 1 billion
Government targets to achieve New & Renewable Energy (NRE) mix of 23% by 2025 and 31% by 2050 (16)
Electricity consumption - 9000 TWh per year by 2050 (17) Solar rooftop potential - 32.5 GW (18)
Estimated Market Value of Rooftop PV Project for 2022-2025 is USD 65.4 mn. Market for utility scale solar PV is expected to be USD 423.5 mn during the 2022-2025 period. (15) Further, 17.8% of the total number of Indonesian households have financial capability to install rooftop solar, equal to 34-116 GWp. (19)
The National General Electricity Plan targets doubling the share of renewable energy generation to 23% of the country’s total generation mix by 2025. Currently, the renewable energy potential is 443 Gigawatts (GW), including a solar energy potential of 208 GW. (17) RE installed capacity has grown by ~4% annually since 2012 (18.9) and employs ~519,196 workers.(20)
Solar energy deployment with a target of 18GW is expected to attract investment of USD 14.4 bn. Further, solar costs currently range between USD 65-137/MWh (real 2020 dollars), but are estimated to fall to USD 27-48/MWh (real 2020 dollars) by 2030, due to lower costs, coupled with more attractive financing terms. (21)
Indicative Return
10% - 15%
15% - 20%
Xurya, a rooftop solar solution provider, tripled its construction of Rooftop Solar Power Plants in 2021. It has operated 57 Rooftop Solar Power Plants and is currently building in 38 other locations from various industries and businesses that are increasingly diverse. (22)
Other Solar PV operators like Vena Energy reported revenue of USD 32.1 mn in 2020. Revenue from Indonesia solar contracts in H1-2020: USD 3.7 mn (23)
Private Equity firms target 20-25% IRRs on their investment. Returns depend on stage of investment and the valuation at the time of exit. Example: Seed fund investors will earn a better return if they hold their investment, than the investors who enter at a later stage.
Investment Timeframe
Long Term (10+ years)
As per experts, most catalytic funds are patient investors and invest for 10 years and more. Most VCs invest for 5-8 years. As RE space is new and evolving, the investment gestation period is long. However, the gestation period for Solar rooftop based investments can be shorter than that for Solar PV.
As per expert discussions, the gestation time for solar rooftop project developments can be relatively short. If the initial set-up related approvals are in place, a good return could potentially range from 6 months to a year.
Concession period based on a Build-Operate-Transfer (BOT) model for RE projects can be for 20-30 years. (23)
Ticket Size
> USD 10 million
Market Risks & Scale Obstacles
Market - Highly Regulated
Market - Volatile
Business - Supply Chain Constraints
Impact Case
Sustainable Development Need
Need to accelerate the development of power plants to increase national electric power generation, focused also on the development of transmission, distribution, substation networks by increasing the utilization of new renewable energy. (1)
Need to increase the use of new renewable energy to its full potential. Out of Indonesia's total electricity generation in 2018, new and renewable energy constitutes only 17.1%, with fossil energy dominating a majority of the share at 81.3% (5)
Renewable power in Indonesia has not developed fully due to high initial investment costs, geographical location and low efficiency. As of now, NRE proportion to total primary energy is expected to reach 12.9% in 2025 and 14.9% in 2050, as against government's target of 23% by 2025. (1)
Gender & Marginalisation
Need to reduce regional disparities in access to electricity as several regions still lack equitable distribution of electricity. The electrification ratio in East Nusa Tenggara still lags behind at 61.9% while most provinces’ electrification ratios are >85%. (1)
Adequate and equitable access to clean energy services can drive economic opportunities to address the needs of vulnerable sections of society, including rural women or low-income households, who still use unclean and inefficient energy sources to cook using wood-fired stoves. (8)
Expected Development Outcome
Reduce dependence on the use of fossil fuel energy by developing solutions for clean and sustainable energy production and usage for household and commercial use. (14)
Development of technology and talent to accelerate the transition to a new renewable energy future and ensure a clean energy environment. (22)
Scaling-up of business models in this space could contribute to an estimated fall of solar costs in terms of lowered equipment and development costs, from USD 65-137/MWh (real 2020 dollars) to USD 27-48/MWh (real 2020 dollars) by 2030. (21)
Gender & Marginalisation
'Encourage sustainable behaviour and lifestyle by promoting usage of Solar PV in households to improve access to electricity in all regions and help women in remote areas get access to efficient resources. RPRE provides electricity generation assistance and services to people in remote areas.
Provision of sufficient and equitable access to clean energy services to improve the livelihood of rural women by maintaining familial health and welfare, as well as increased income/economic opportunities, through energy-intensive activities such as weaving, cooking.
Expanding and evenly distributing the electricity supply throughout the country, including border and remote areas, and islands. (1)
Primary SDGs addressed

7.1.1 Proportion of population with access to electricity
7.2.1 Renewable energy share in the total final energy consumption
7.3.1 Energy intensity measured in terms of primary energy and GDP
Proportion of population with access to electricity 2011 - 72.95 2020 - 99.20 Electricity consumption per capital (KWH) 2011 - 740 2020 - 1089 (26)
2015 - 6.7 2020 - 11.20 (26)
2015 - 501 2019 - 424.87 (18.10) 2020-133.5 (12)
Electric power consumption per capita: 2035 KWH Electric power consumption per capita in 2030 with business-as usual scenario 3,201 KWH Electric power consumption per capita in 2030 with intervention scenario (1)
Renewable energy mix: 12.1% - Renewable energy mix in 2030 with business-as-usual scenario 26.1% - Renewable energy mix in 2030 with intervention scenario (1)
138 in 2021, 136.6 in 2022, 135.2 in 2023, and 133.8 in 2024 (12)
Secondary SDGs addressed


Directly impacted stakeholders
People
Gender inequality and/or marginalization
Planet
Corporates
Public sector
Indirectly impacted stakeholders
People
Corporates
Public sector
Outcome Risks
Some experts state that an increase in the implementation of solar rooftop projects would increase the electricity supply in Indonesia, thereby worsening PLN’s [the State owned electricity company] debt burden (USD 35 bn in 2021). (18)
For this investment opportunity to be profitable, smart grids and energy storage development are required to resolve the intermittency of renewable energy supplies and to ensure the country’s future national electricity resilience. (18)
Currently, there are no incentives for the residential households to use solar PV panels. Since the initial cost of installation is high, the demand from households may continue to be restricted.
Consumers need to be educated to understand not only the benefits of using solar energy, but also the method of implementation and usage.
Gender inequality and/or marginalization risk: Regional disparity as some regions may be more suitable for efficient generation of solar power leading to fragmented access to alternative electricity sources.
Impact Risks
Usage of RE based electricity will reduce the burden on the grid during high consumption hours. (Example: summer months, night time, etc.]
Without increase in installation RE based power plants, the Government will not be able to achieve its target of net-zero emissions by 2060, and hamper its national energy security in the long term.
Existing regulations hinder uptake of renewable energy generation technologies (such as PV). Current power purchase tariff regulations force clean energy to compete with subsidized coal power.
Gender inequality and/or marginalization risk: Remote areas will continue to face electricity shortage, leading to regional disparities.
Impact Classification
What
Usage of Solar PV and rooftop solar to generate electricity for household, industrial and commercial usage
Who
Various; Population benefits from clean energy generation which can enable them to reduce their electricity cost in the long-term
Risk
High upfront cost and low return on investment restrict the growth of solar rooftop development in Indonesia (18)
Contribution
Investment in RE projects in Indonesia is projected to reach USD 12 bn, creating 34,000 job opportunities, with 19 metric ton CO2 equivalent of emission reduction potential. (27)
How Much
Solar rooftop potential is ~32.5 GW. (18) Solar PV accounts for 908 MW of total planned generation capacity (2019 RUPTL), scaling up could increase the share of clean energy at 3.7 GW. (36)
Impact Thesis
Solar-based electricity generation to serve household, commercial and industrial needs and increase the proportion of RE in the total energy mix.
Enabling Environment
Policy Environment
2020-2024 MOEMR Strategic Plans: GOI's energy and electricity policies comprise of energy and electricity diversification, efficiency improvement, expansion of supply, and governance. NRE and energy conservation will be prioritized to fulfill energy demand (28)
2020-2024 MOEMR Strategic Plans: GoI aims to implement rural and last-mile electrification for communal villages/households, by providing microgrid off-grid solutions prioritizing the use of the nearest RE available, such as communal solar plants (PLTS). (28)
Law No. 30/2007 on Energy: NRE is managed and regulated by the GoI and is utilized for Indonesian citizens welfare (29)
MEMR Strategic Plans 2020-24: GoI aims to develop portable solar plants (PLTS), or Solar Home Systems for introducing electrification in remote villages in the Frontier, Outermost, and Least (3T) Developed regions, that are unable to access existing power transmission networks/grids. (28)
MEMR Strategic Plans 2020-24: Development Agenda 5 aims to strengthen infrastructure to support economy and basic services, including utilization of solar rooftops and floating solar power plants, and the development of solar cell or solar photovoltaic (PV) industry in the country. (28)
Financial Environment
Financial incentives: BKPM Regulation No. 5/2020, provides an Income Tax Facility through six-year net income reduction of 5% annually or 30% of the investment value in the form of tangible fixed assets including land, used for main business activities. (34)
Fiscal incentives: MOF Regulation No. 66/2015; BKPM Regulation No. 6/2018 allows 4-year duty free raw material import if the company uses at least 30% local production machines and equipment. (35)
Other incentives: MOF Regulation No. 35/2018 states that new pioneer industry investment can get tax holiday facilities of 100%, income tax reduction in 5-20 years with investment of USD 35 mn-2 bn, and mini tax holiday of 50% income tax reduction in 5 years with investment of USD 7-34.9 mn. (36)
Regulatory Environment
Government Regulation No. 79/2014 on Indonesia’s National Energy Plan: Energy development must take into account energy economy balance, energy supply security, environmental conservation, access to affordable energy, and local base energy resources (30)
Presidential Regulation No. 22/2017 on National Energy General Plans (RUEN): GoI targets 6.5 GW solar power plant capacity by 2025. All government buildings and houses/apartments would utilize ~30% and ~25%, respectively, of their rooftops for solar panels, with a building permit (IMB). (31)
Presidential Regulation No. 22/2017: It also mandates the facilitation of a sustainable solar power plant industry development. (31)
MEMR Regulation No 4/2020 concerns RE tariff guidelines in Indonesia, and are pegged to local and national average cost of generation: PT PLN is mandated to operate NRE base power plants to generate its supply (32)
BKPM Regulation Number 4 of 2021: The exception to the minimum investment value requirement for foreign capital states that the total investment should be >USD 0.6 mn, excluding land and buildings, covering Electrical Equipment Industry, including manufacture of photovoltaic module equipment. (33)
Marketplace Participants
Private Sector
Corporates: PT Xurya Daya Indonesia, Solar Kita, PACE Energy, Right People Renewable Energy (RPRE), Vena Energy Investors: Clime Asset Management Pty Ltd., PT Saratoga Investama Sedaya Tbk, Schneider Electric, New Energy Nexus, East Ventures, South East Asia Clean Energy
Government
Ministry of Energy and Mineral Resources, Ministry of Public Works and Housing, Ministry of Transportation, Ministry of Environment and Forestry, Ministry of Finance, National Energy Council (DEN), Indonesian Chamber of Commerce (KADIN)
Multilaterals
United Nations Development Programme (UNDP), United Nations Environment Programme (UNEP), Association of South East Asian Nations (ASEAN), ASEAN Infrastructure Fund, Asian Development Bank, World Bank, Clean Energy Fund, Deutsche Gesellschaft für Internationale Zusammenarbeit (GIZ)
Non-Profit
Yayasan Rumah Energi, Walhi, Indonesian Solar Energy Association (AESI)
Public-Private Partnership
PT. Sarana Multi Infrastruktur (PT. SMI)
Target Locations
Indonesia: Kalimantan
Indonesia: Java
Indonesia: Sumatra
References
- (1) Republic of Indonesia. 2019. Roadmap of SDGs Indonesia Towards 2030. https://www.unicef.org/indonesia/media/1626/file/Roadmap%20of%20SDGs.pdf.
- (2) Ministry of Energy and Mineral Resources of the Republic of Indonesia. 2021. Press Release: Indonesia Needs Concrete and Planned Efforts to Meet the 23% Renewables Target by 2025, Says Energy Minister. https://www.esdm.go.id/en/media-center/news-archives/indonesia-needs-concrete-and-planned-efforts-to-meet-the-23-renewables-target-by-2025-says-energy-minister
- (3) Republic of Indonesia. 2021. Updated Nationally Determined Contribution. https://www4.unfccc.int/sites/ndcstaging/PublishedDocuments/Indonesia%20First/Updated%20NDC%20Indonesia%202021%20-%20corrected%20version.pdf.
- (4) Republic of Indonesia. 2021. Presidential Regulation (Perpres) No.18/2020 concerning the 2020-2024 National Medium-Term Development Plan. https://jdih.setkab.go.id/PUUdoc/176020/Perpres_Nomor_18_Tahun_2020.PDF.
- (5) Republic of Indonesia. 2020. Indonesia's 2020-2024 National Medium-Term Development Plan (RPJMN). https://perpustakaan.bappenas.go.id/e-library/file_upload/koleksi/migrasi-data-publikasi/file/RP_RKP/Narasi-RPJMN-2020-2024-versi-Bahasa-Inggris.pdf.
- (6) Safrina, Rika. ASEAN Centre for Energy, 2021. COP26: ASEAN’s Commitment in The Energy Sector. https://aseanenergy.org/cop26-aseans-commitment-in-the-energy-sector-economy/.
- (7) Aldila, Nindya. Bisnis.com, 2021. Wapres Ma'ruf Soroti Ketimpangan Akses Energi Bagi Rakyat Miskin. https://ekonomi.bisnis.com/read/20210201/44/1350834/wapres-maruf-soroti-ketimpangan-akses-energi-bagi-rakyat-miskin)
- (8) Misna, Andriah. ASEAN Climate Change and Energy Project (ACCEPT), 2021. Indonesia – Perspective of Women towards Inclusive Energy Transition in ASEAN. https://accept.aseanenergy.org/indonesia-perspective-of-women-towards-inclusive-energy-transition-in-asean/#:~:text=There%20is%20an%20increase%20in,2011%20to%2027.5%25%20in%202021.
- (9) State Electricity Company (PT. PLN). 2021. Electricity Supply Business Plan (RUPTL) 2021-2030. https://web.pln.co.id/statics/uploads/2021/10/ruptl-2021-2030.pdf.
- (10) Asian Development Bank (ADB). 2020. Indonesia Energy Sector Assessment, Strategy, and Road Map Update 2020. https://www.adb.org/sites/default/files/institutional-document/666741/indonesia-energy-asr-update.pdf.
- (11) Shofa, Jayanty. JakartaGlobe, 2021. PLN to Gradually Retire Coal-Fired Power Plants. https://jakartaglobe.id/business/pln-to-gradually-retire-coalfired-power-plants
- (12) Sekretariat Nasional SDGs. 2019. Indonesia's SDG National Action Plans (RAN) SDGs 2021-2024.
- (13) Statistics Indonesia (BPS). 2018-2020. Electricity Consumption per Capita (MWH/Capita). https://www.bps.go.id/indikator/indikator/view_data/0000/data/1156/sdgs_7/1
- (14) East Ventures. 2022. Xurya receives US$21.5 million series A funding from investors led by East Ventures and Saratoga. https://east.vc/east-ventures/xurya-seriesa-funding-led-by-east-ventures-and-saratoga/
- (15) U.K. Foreign & Commonwealth Office of the British Embassy Jakarta. Indonesia Renewable Energy Business Opportunities. https://www.the-eic.com/portals/0/Website/Publications/Indonesia-Business-Opportunities-Study.pdf
- (16) Republic of Indonesia. 2014. Government Regulation (PP) No. 79/2014 concerning Indonesia’s National Energy Plan. https://jdih.esdm.go.id/peraturan/PP%20No.%2079%20Thn%202014.pdf
- (17) Silalahi, David. et al. Energies, 2021. Indonesia’s Vast Solar Energy Potential. https://doi.org/10.3390/en14175424
- (18) Cindy, Massita Ayu and Fitriyanti, Vivi. The Diplomat, 2021. A Turning Point for Renewable Energy in Indonesia? https://thediplomat.com/2021/10/a-turning-point-for-renewable-energy-in-indonesia/
- (19) Saputra, Gandabhaskara. Institute for Essential Services Reform (IESR), 2019. Harnessing Indonesia’s Solar Potential: Yellow is The New Black. https://iesr.or.id/harnessing-indonesias-solar-potential-yellow-is-the-new-black
- (20) Australian Department of Foreign Affairs and Trade (DFAT). 2021. A Blueprint for Trade and Investment with Indonesia. https://www.dfat.gov.au/sites/default/files/blueprint-trade-investment-indonesia.pdf
- (21) BloombergNEF. 2021. Indonesian Solar Market Poised for Unprecedented Growth, Holds Key to Decarbonizing Energy Sector. https://about.bnef.com/blog/indonesian-solar-market-poised-for-unprecedented-growth-holds-key-to-decarbonizing-energy-sector/
- (22) Digital News Asia. 2022. Indonesia’s Xurya Receives US$21.5 mil Series A led by East Ventures and Saratoga. https://www.digitalnewsasia.com/startups/indonesias-xurya-receives-us215-mil-series-led-east-ventures-and-saratoga
- (23) Vena Energy. 2021. Vena Energy Combined Financials - 1H 2020 (Financial Report). https://www.venaenergy.com/wp/wp-content/uploads/2021/09/Vena-Energy_1H-2020-Financial-Report.pdf
- (24) Ministry of Industry of the Republic of Indonesia. 2017. Minister Regulation No.4/2017 concerning local-content requirements (TKDN) for solar panels. http://jdih.kemenperin.go.id/site/baca_peraturan/2286
- (25) Institute for Essential Services Reform (IESR). 2021. Beyond 207 Gigawatts: Unleashing Indonesia’s Solar Potential. https://iesr.or.id/wp-content/uploads/2021/03/Unleashing-Indonesias-Solar-Potential-Technical-Note-FINAL1.pdf
- (26) Republic of Indonesia. 2021. Voluntary National Review: Annexes. https://sdgs.bappenas.go.id/laporan-voluntary-national-review-vnr-indonesia-2021/
- (27) Ministry of Investment/BKPM of the Republic of Indonesia. 2021. Harnessing renewable energy investment sector in Indonesia. https://www.bkpm.go.id/en/publication/detail/news/harnessing-renewable-energy-investment-sector-in-indonesia
- (28) Ministry of Energy and Mineral Resources of the Republic of Indonesia. 2020. The Ministry of Energy and Mineral Resources 2020-2024 Strategic Plans. https://www.esdm.go.id/assets/media/content/content-rencana-strategis-kesdm-2020-2024.pdf
- (29) Republic of Indonesia. 2007. Law No.30/2007 concerning Energy. https://jdih.esdm.go.id/peraturan/uu-30-2007.pdf
- (30) Republic of Indonesia. 2014. Government Regulation (PP) No. 79/2014 concerning Indonesia’s National Energy Plan. https://jdih.esdm.go.id/peraturan/PP%20No.%2079%20Thn%202014.pdf
- (31) Republic of Indonesia. 2017. Presidential Regulation (Perpres) No. 22/2017 concerning National Energy General Plans (RUEN). https://jdih.esdm.go.id/storage/document/Perpres%2022%20Tahun%202017.pdf
- (32) Ministry of Energy and Mineral Resources (MEMR) of the Republic of Indonesia. 2020. MEMR Regulation No.4/2020 concerning Risk-Based Business Licensing Services and Investment Facilities. https://jdih.esdm.go.id/storage/document/Permen%20ESDM%20Nomor%204%20Tahun%202020.pdf
- (33) Indonesia Investment Coordinating Board (BKPM). 2021. BKPM Regulation No.4/2021. https://jdih-storage.bkpm.go.id/jdih/userfiles/documents/2021/10/2021PerBKPM004.pdf
- (34) Indonesia Investment Coordinating Board (BKPM). 2020. BKPM Regulation No.5/2020, revoking BKPM Regulation No.6/2018, concerning Guidelines of Entity Income Tax Incentives in Certain Industries and/or Regions. https://peraturan.bpk.go.id/Home/Details/169073/peraturan-bkpm-no-5-tahun-2020
- (35) Ministry of Finance (MoF) of the Republic of Indonesia. 2015. MoF Regulation No.66/2015. https://jdih.kemenkeu.go.id/in/dokumen/peraturan/33b4ea80-8c90-4220-9f84-5696f0fd08df
- (36) Ministry of Finance (MoF) of the Republic of Indonesia. 2020. MoF Regulation No.130/2020, revoking MoF Regulation No.150/2018, revoking MoF Regulation No.35/2018; concerning the Granting of Corporate Income Tax Facilities. https://jdih.kemenkeu.go.id/in/dokumen/peraturan/33b4ea80-8c90-4220-9f84-5696f0fd08df
- (37) Institute for Essential Services Reform (IESR). 2021. Beyond 207 Gigawatts: Unleashing Indonesia’s Solar Potential. https://iesr.or.id/wp-content/uploads/2021/03/Unleashing-Indonesias-Solar-Potential-Technical-Note-FINAL1.pdf
- (38) Cindy, Massita Ayu and Fitriyanti, Vivi. The Diplomat, 2021. A Turning Point for Renewable Energy in Indonesia? https://thediplomat.com/2021/10/a-turning-point-for-renewable-energy-in-indonesia/
- (39) Digital News Asia. 2022. Indonesia’s Xurya Receives US$21.5 mil Series A led by East Ventures and Saratoga. https://www.digitalnewsasia.com/startups/indonesias-xurya-receives-us215-mil-series-led-east-ventures-and-saratoga
- (40) Ministry of Finance (MoF) of the Republic of Indonesia. 2010. MoF Regulation No.21/2010 concerning the Granting of Tax and Customs Facilities for Activities Utilizing Renewable Energy. https://jdih.kemenkeu.go.id/in/dokumen/peraturan/2d42d4e0-eb7c-4f26-8473-e9e40e7cef11

