


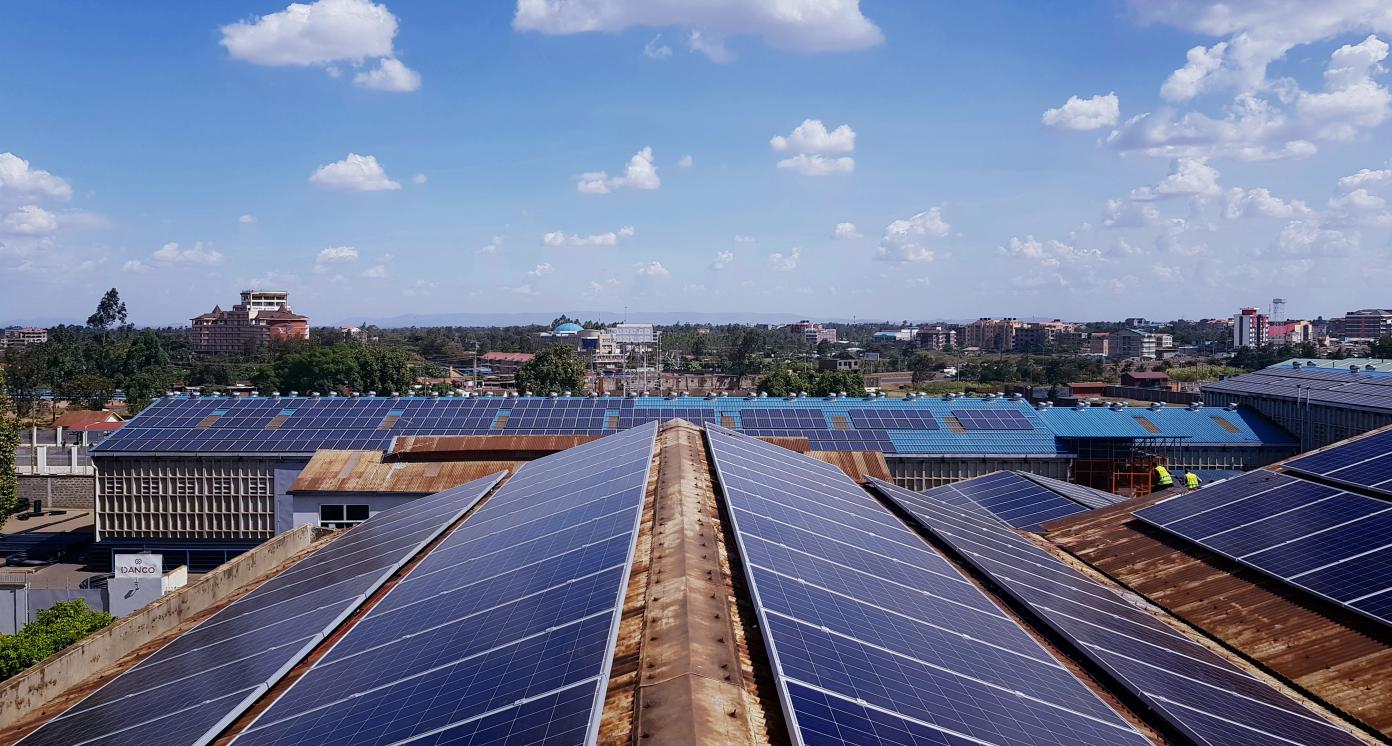
Rooftop Solar Systems
Rooftop Solar Systems
Business Model Description
Develop and operate rooftop solar energy systems to provide lighting and energy for other domestic and industrial uses, such as refrigerators, water heaters and other appliances, for residential and industrial consumers specifically in areas where the national grid does not reach.
Expected Impact
Enhance energy supply for consumptive and productive purposes in areas where the national electricity grid does not reach.
How is this information gathered?
Investment opportunities with potential to contribute to sustainable development are based on country-level SDG Investor Maps.
Disclaimer
UNDP, the Private Finance for the SDGs, and their affiliates (collectively “UNDP”) do not seek or solicit investment for programmes, projects, or opportunities described on this site (collectively “Programmes”) or any other Programmes, and nothing on this page should constitute a solicitation for investment. The actors listed on this site are not partners of UNDP, and their inclusion should not be construed as an endorsement or recommendation by UNDP for any relationship or investment.
The descriptions on this page are provided for informational purposes only. Only companies and enterprises that appear under the case study tab have been validated and vetted through UNDP programmes such as the Growth Stage Impact Ventures (GSIV), Business Call to Action (BCtA), or through other UN agencies. Even then, under no circumstances should their appearance on this website be construed as an endorsement for any relationship or investment. UNDP assumes no liability for investment losses directly or indirectly resulting from recommendations made, implied, or inferred by its research. Likewise, UNDP assumes no claim to investment gains directly or indirectly resulting from trading profits, investment management, or advisory fees obtained by following investment recommendations made, implied, or inferred by its research.
Investment involves risk, and all investments should be made with the supervision of a professional investment manager or advisor. The materials on the website are not an offer to sell or a solicitation of an offer to buy any investment, security, or commodity, nor shall any security be offered or sold to any person, in any jurisdiction in which such offer would be unlawful under the securities laws of such jurisdiction.
Country & Regions
- Tanzania: Countrywide
- Tanzania: Southern Zone
- Tanzania: Lake Zone
- Tanzania: Western Zone
- Tanzania: Central Zone
Sector Classification
Renewable Resources and Alternative Energy
Development need
Energy is important in promoting Tanzania's industrial development. This applies particularly to transforming productive sectors like agriculture, which are beset by challenges of low productivity. However, the energy sector itself is faced with challenges, including unreliability and inefficiencies in supply (1, 2, 3).
Policy priority
The Tanzanian government recognizes energy as important in promoting socio-economic development. It is committed to promote improved performance and spur prudent and optimal use of the energy resources so as to tap into unutilized potential in the productive sectors. Over the medium to long run, the government seeks to implement its 100% renewable energy policy (1, 4).
Gender inequalities and marginalization issues
Energy is a critical enabler in reaching socio-economic development goals for men and women. However, the benefits of increased access to modern and cleaner energy services often fail to accrue evenly to both gender. Women bear the burden of inefficient energy technologies, which in turn affects their health, time and productivity (5).
Investment opportunities introduction
Tanzania is endowed with diverse energy sources, including natural gas, biomass, hydro, geothermal, solar and wind power, much of which is untapped. Significant opportunities exists in the exploration of new and renewable energy resources and promotion of energy efficiency technologies and conservation initiatives (6).
"Key bottlenecks introduction
About 50% of the Tanzania's population lives in poverty, out of which 35% is unable to access all of the basic needs, including energy services. The poor spend about 35% of their household income on energy, compared to 14% for other socio-economic groups, which may result in limited purchasing power (7)."
Alternative Energy
Development need
Tanzanian energy sector is faced with several challenges, including lack of adequate and sustainable energy diversification systems; insufficient promotion and use of energy efficient technologies and behaviors; and inability to optimally utilize the renewable energy potential across the country (1, 4, 25).
Policy priority
Tanzania's government is committed to increase power generation predominantly by using renewable sources, such as hydropower, wind, solar and thermal energies. The emphasis is premised on the fact that if renewable energy is produced and utilized in a modern and sustainable manner, it will help to eliminate energy shortages and inefficiencies in the country (8).
Gender inequalities and marginalization issues
Increasing access to modern energy services can make a significant difference in women’s lives in terms of their health, time use, education and income generation. Given the opportunity, women have demonstrated that they can be producers and suppliers of energy products, as well as energy service providers (9).
Investment opportunities introduction
Alternative energy opportunities exist in the manufacturing and distribution of solar panel and kits, energy storage systems, solar generators, inverters, chargers and charger controllers (10).
Key bottlenecks introduction
Solar has not been utilized fully as energy sources in Tanzania, even though the country is in one of the major global solar belts, with 2,800-3,500 hours of sunshine per year and a global radiation of 4-7 kWh/m2 per day. Despite this potential, solar energy has predominately been used for drying to date (11).
Solar Technology and Project Developers
Pipeline Opportunity
Rooftop Solar Systems
Develop and operate rooftop solar energy systems to provide lighting and energy for other domestic and industrial uses, such as refrigerators, water heaters and other appliances, for residential and industrial consumers specifically in areas where the national grid does not reach.
Business Case
Market Size and Environment
< USD 50 million
< 5%
1 million solar-powered homes in Tanzania
Tanzania's estimated market value for rooftop solar systems is US 11.6 million. However, sales through the Cash+PayGo business model had a negative CAGR of -19% between 2014 and 2018. This implies a need to adopt an alternative consumer financing model, such as PayGO only (13).
The solar energy market in Tanzania has drastically grown and increased over the last few years. Solar energy is used mostly in rural areas with about 64.8% compared to urban areas with only 3.4%. Close to six million people were supplied with improved solar energy access from 2016 to 2018. The number of off-grid transactions went up from 36 in 2017 to 107 in 2018 (13, 14).
Currently, there are more than one million solar-powered homes in Tanzania, with solar photovoltaic (PV) panels ranging from 10 to 100 kW per home (14).
Indicative Return
10% - 15%
An economic evaluation of off Feed-in-Tariff (FiT) rooftop solar energy system in Tanzania shows a positive Net Present Value (NPV) and an IRR of 5-25%. The investment can yield positive results for investors for a period of 15 years (16).
An analysis of four USAID Off-Grid Solar Investments suggests that an USD 8.4 million investment is creating over USD 17 million in NPV to Tanzania and its neighbours Rwanda and Uganda (13).
Investment Timeframe
Medium Term (5–10 years)
In a benchmark project from Uganda, an investment for a USD 250,459 off Feed-in-Tariff (FiT) rooftop solar energy system start yielding positive results from year 7 all through to year 15 (16).
Ticket Size
< USD 500,000
Market Risks & Scale Obstacles
Market - Highly Regulated
Business - Supply Chain Constraints
Market - High Level of Competition
Impact Case
Sustainable Development Need
Out of half the Tanzanians that live in poverty, 35% is unable to access all of the basic needs, including energy services. The poor spend about 35% of their household income on energy while the better offs spend only 14%. Lack of access to modern energy services creates a vicious cycle of poverty for rural communities due to continued limited production opportunities (23).
Traditional biomass accounts for 90% of total primary energy consumption in Tanzania. Nearly 1 million tons of charcoal consumed each year produces 20-50 million tons a year in CO2 emissions, and requires an estimated 30 million m3 of wood, with annual average loss in forest cover at 100,000-125,000 hectares. This energy supply and end use structure reflects Tanzania’s low level of development and contributes to the intensification and perpetuation of poverty (4).
Tanzania is mostly dependent on imported fossil fuels for its electricity particularly petroleum products. The country imports an average of 4.6 billion litres of petroleum products per year. This represents a heavy burden for the country’s socio-economic development and energy plans. Increasing dependency on fossil fuels is causing fuel price shocks, inflation and it is hindering government efforts to expand energy access due to the scarcity of financial resources (4).
Despite its large abundance and reliability, solar power constitutes only a small share of installed energy capacity in Tanzania. Out of the total electrified households, 74.9% and 24.7% are electrified with national grid and solar power, respectively (12).
Gender & Marginalisation
Electricity connection is estimated at 24% nationally, and only 11% in rural areas. Access to modern energy services is vital to agricultural productivity, income generation and education. Women, who shoulder a disproportionate responsibility for household fuel and water collection, food preparation and agriculture, are especially affected by an unreliable energy supply (26).
Prices of imported fossil fuels are volatile and have been hindering efforts to rural energy access. Additionally, due to problems with maintenance and supply, the country suffers regular power cuts and high electricity losses of 21-23%. All these limit poor and rural communities to access energy, and hinders efforts to uplift themselves from poverty (27).
Expected Development Outcome
Rooftop solar systems help to meet Tanzania's energy needs. It can play a key role in the provision of affordable, sustainable and locally generated electricity (4).
Promoting renewable energy sources through rooftop solar systems reduces Tanzania's overreliance on imported fossil fuels, particularly given the growing energy needs. It also provides an alternative to biomass energy, which is currently used for cooking (3).
The energy generated through rooftop solar systems provides productive use opportunities in a number of sectors, such as agriculture, commercial enterprises and industrial activities, which allows for greater income generation (13).
Gender & Marginalisation
Rooftop solar systems offer energy solutions to women and other marginalized groups by reducing the drudgery of collecting wood for cooking (13, 17, 26).
Rooftop solar systems provide entrepreneurship opportunities for women, especially for the sale of solar lights (besides efficient cookstoves) to rural communities (13, 17).
Primary SDGs addressed
7.1.1 Proportion of population with access to electricity
7.2.1 Renewable energy share in the total final energy consumption
Population with access to electricity estimated at 78.4% in 2020/21 (1). Proportion of households connected to electricity in 2020/21 estimated at 39.9% (1).
The share of renewable energy in the total final energy consumption estimated at 83.828 in 2017 (27).
Population with access to electricity projected at 85% in 2025/26 (1). Proportion of households connected to electricity in 2025/26 projected at 60.0 % (1).
N/A
9.4.1 CO2 emission per unit of value added
Carbon dioxide emissions per dollar of manufacturing estimated at 11,580 kt in 2018 (28).
N/A
13.2.2 Total greenhouse gas emissions per year
Tanzania’s total greenhouse gas (GHG) averages 286.49 million metric tons of carbon dioxide equivalent (MtCO2e), totalling 59% of GHG emissions per year (24, 29).
In its Intended Nationally Determined Contribution (INDC), Tanzania states its goal to embark on a climate resilient development pathway that will reduce GHG emissions by 10% to 20% by 2030, relative to the projected 2030 business-as-usual emissions of 138-153 MtCO2e (24, 29).
Secondary SDGs addressed
Directly impacted stakeholders
People
Planet
Corporates
Public sector
Indirectly impacted stakeholders
People
Gender inequality and/or marginalization
Planet
Corporates
Public sector
Outcome Risks
The end use of the rooftop solar systems may create significant environmental damage if not managed well. This is particularly the case because renewable energy technologies in developing countries, including Tanzania, are new. A lot of people have insufficient understanding of these technologies in terms of their establishment, application, and socio-economic and environmental importance (12).
Impact Risks
Unavailability of equipment, inputs, accessories and spare parts could may limit the efficiency of rooftop solar systems and hence limit the impact.
Lack of quality control standards and enforcement, resulting in low-quality products being sold in the local market, may compromise the impact of the rooftop solar systems.
If the rooftop solar systems are not affordable to low-income communities, for example due to unsuitable financing options provided, the expected impact may be limited.
Impact Classification
What
Rooftop solar systems provide energy for consumptive and productive purposes, and mitigate environmental impacts of non-renewable energy sources currently used.
Who
Low-income households, especially those not within the reach of the electricity grid, solar power companies and distribution actors, and the environment benefit from rooftop solar systems.
Risk
While the rooftop solar system model is proven, input availability, quality of products and affordability and access for low-income communities require consideration.
Impact Thesis
Enhance energy supply for consumptive and productive purposes in areas where the national electricity grid does not reach.
Enabling Environment
Policy Environment
National Energy Policy, 2003: Outlines government commitment to promote environmentally sound technologies. It also emphasises the role of private sector in reducing the stress on resources use and the environment. The central role of science and technology in the exploitation, processing and utilization of natural resources is also highlighted (31).
National Rural Electrification Program, 2013: Outlines government commitment to increase access to electricity in rural areas and scale up the supply of renewable energy in rural areas. Key areas of focus are renewable technologies, including solar photovoltaic (PV), wind, biofuels and geothermal (32).
National Energy Policy, 2015: Outlines government commitment to enhance utilization of renewable energy resources for power generation and promote energy efficiency and conservation in all sectors of the economy (33).
National Five Year Development Plan, 2021 (FYDP III): Promotes improvements in infrastructure networks to attain low-cost energy service that allows more inflow of investments and make Tanzania a destination for producing efficient and competitive goods and services as well as a source for competitive energy supplies within the region (1).
Financial Environment
Financial incentives: The Tanzania Rural Electrification Expansion Project provides renewable energy companies with credit lines of USD 10-30 million. It also offers working capital and term loans to renewable energy companies and small power producers (13).
Fiscal incentives: For solar components, such as panels, batteries, inverters and regulators, Tanzania offers exemption of import taxes (import duty and VAT) (13). In general, Tanzania offers 0% import duty on project capital goods, as well as allows 50% capital allowances in the first year of use for plant and machinery used in manufacturing processes (21).
Regulatory Environment
Rural Energy Act 2005: Establishes the Rural Energy Board, Fund and Agency to be responsible for promotion of improved access to modern energy services in the rural areas of Tanzania (34).
Energy and Water Utilities Regulatory Authority (EWURA) Act 2001: Establishes a Regulatory Authority in relation to energy and water utilities and provides for its operations. (35).
Small Power Producer (SPP) Policy, 2008: Provides the regulatory framework encouraging low-cost investment mini-grids. It create a feed-in tariff that is technology-neutral (13).
Tanzania Bureau of Standards (TBS) Quality Control Regulations, 2018: Provides the basic standards required for solar products. It allows for testing, verification and registration of products (13).
Marketplace Participants
Private Sector
=SimuSolar, Mobisol, Ensol, JUMEME, PowerCorner, Solar Sisters. D.light, Green Light Planet, ZOLA, Solaris-Tanzania, Jaza, Solar Grid, Sunny Money, Ensol, Arti, Solar Grid.
Government
Ministry of Energy and Minerals, Energy and Water Utilities Regulatory Authority (EWURA), Tanzania Bureau of Standards (TBS), Arusha Technical College, University of Dar es Salaam College of Engineering and Technology, Tanzania Renewable Energy Business Incubator.
Multilaterals
World Bank Group (WBG), United Nations Development Programme (UNDP), UN Environment.
Non-Profit
USAID (East Africa Energy Program and Power Africa Off-Grid Project), Tanzania Renewable Energy Association (TAREA), Tanzania Gender and Sustainable Energy Network (TANGSEN), Tanzania Association of Microfinance Institutions (TAMFI), Savings and Credit Cooperative Union League of Tanzania (SCCULT).
Public-Private Partnership
Global Off-Grid Lighting Association (GOGLA), Overseas Private Investment Cooperation (OPIC).
Target Locations

Tanzania: Countrywide
Tanzania: Southern Zone
Tanzania: Lake Zone
Tanzania: Western Zone
Tanzania: Central Zone
References
- (1) United Republic of Tanzania, 2021. Third National Five-Year Plan.
- (2) United Republic of Tanzania, 2015. National Energy Policy.
- (3) World Future Council, 2017. Climate Action Network for Tanzania, Policy Road Map for 100% Renewable Energy and Poverty Eradication in Tanzania.
- (4) Institute for Sustainable Futures, 2017. A 100% Renewable Energy for Tanzania, Access to Renewable Energy all within One Generation.
- (5) African Development Bank, 2017. Gender Country Briefs – Tanzania.
- (6) United Nations Development Programme, 2015. Tanzania’s Se4All Investment Prospectus.
- (7) German Technical Cooperation, 2007. Eastern Africa Resource Base: GTZ Online Regional Energy Resource Base: Regional and Country Specific Energy Resource Database: IV - Energy Policy.
- (8) Clean Technologies, 2018.The Potential Renewable Energy for Sustainable Development in Tanzania: A Review.
- (9) International Network on Gender & Sustainable Energy, 2011. Mainstreaming Gender in Energy Projects. A Practical Handbook.
- (10) SmartSolar Tanzania, 2022. The Information Platform for Solar in Tanzania, Smartsolar. www.tanzania.com/solar-sector-information/regulations-for-solar-in-tanzania.
- (11) Mashauri Adam Kusekwa, 2013. Biomass Conversion to Energy in Tanzania: A Critique. https://www.intechopen.com/chapters/40651.
- (12) Clean Technologies, 2018. The Potential Renewable Energy for Sustainable Development in Tanzania: A Review.
- (13) United States Agency for International Development, 2019. Off-Grid Solar Market Assessment Tanzania.
- (14) Mathew Matimbwi et al, 2020. Tanzania Energy Situation.
- (15) United Nations Climate Change, 2020. A Mobisol Smart Solar Homes, Rwanda and Tanzania.
- (16) United States Agency for International Development, 2022. Tanzania Power Africa Fact Sheet. https://www.usaid.gov/powerafrica/tanzania.
- (17) GET.INVEST, 2022. Market Insights, Uganda: Captive Power Case Study: 300 kWp Rooftop Solar PV System at an Office Building. https://www.get-invest.eu/market-insights.
- (18) Tanzania Invest, 2220. https://www.tanzaniainvest.com.
- (19) International Trade Administration, 2021. Energy Resource Guide, Tanzania.
- (20) The UK Department for International Development (DFID), 2019. Tanzania Market Snapshot, Horticulture Value Chains and Potential for Solar Water Pump Technology.
- (21) United Republic of Tanzania, 2010. Public-Private Partnership Act. No. 18.
- (22) United Republic of Tanzania, 2022. Standard Incentives for Investors. https://investment-guide.eac.in.
- (23) International Trade Administration, 2021. Tanzania - Country Commercial Guide. https://www.trade.gov/country-commercial-guides/tanzania-energy.
- (24) Tanzania Energy Situation, Energypedia, 2020. https://energypedia.info/wiki/Tanzania_Energy_Situation.
- (25) Global SDG Indicator Platform, 2022. https://sdg.tracking-progress.org/indicator/9-4-1-carbon-dioxide-emissions-per-unit-of-value-added/?tab=map.
- (26) United Republic of Tanzania, 2021. Intended Nationally Determined Contributions (INDCs).
- (27) Renewable Energy in Africa, 2015. Tanzania Country Profile.
- (28) Access of Civil Society Organisations for Clean Energy Access, 2016. Energy access in Tanzania: the Role of Civil Society Organisations.
- (29) The Global Economy, 2022. https://www.theglobaleconomy.com/Tanzania/carbon_dioxide_emissions.
- (30) United States Agency for International Development, 2018. Greenhouse Gas Emissions Factsheet: Tanzania. https://www.climatelinks.org/resources/greenhouse-gas-emissions-factsheet-tanzania.
- (31) Huria Journal Vol 26 (1), March 2019. AligHnment to Climate Compatible Development: A Content Analysis of the Tanzania National Energy Policy.
- (32) United Republic of Tanzania, 2003. National Energy Policy.
- (33) United Republic of Tanzania, 2013. The National Rural Electrification Program.
- (32) United Republic of Tanzania, 2015. National Energy Policy.
- (34) United Republic of Tanzania, 2005. Rural Energy Act.
- (35) United Republic of Tanzania, 2006. Energy and Water Utilities Authority Act.
- (36) United Republic of Tanzania, 2016. Energy Access Situation Report.