


Public transportation
Public transportation
Business Model Description
Establish efficient public bus transportation systems in the biggest cities and create linkages between city centers and suburban areas.
Expected Impact
Increase the quality of life for Kenyan citizens who suffer from informal and unsafe transport modes.
How is this information gathered?
Investment opportunities with potential to contribute to sustainable development are based on country-level SDG Investor Maps.
Disclaimer
UNDP, the Private Finance for the SDGs, and their affiliates (collectively “UNDP”) do not seek or solicit investment for programmes, projects, or opportunities described on this site (collectively “Programmes”) or any other Programmes, and nothing on this page should constitute a solicitation for investment. The actors listed on this site are not partners of UNDP, and their inclusion should not be construed as an endorsement or recommendation by UNDP for any relationship or investment.
The descriptions on this page are provided for informational purposes only. Only companies and enterprises that appear under the case study tab have been validated and vetted through UNDP programmes such as the Growth Stage Impact Ventures (GSIV), Business Call to Action (BCtA), or through other UN agencies. Even then, under no circumstances should their appearance on this website be construed as an endorsement for any relationship or investment. UNDP assumes no liability for investment losses directly or indirectly resulting from recommendations made, implied, or inferred by its research. Likewise, UNDP assumes no claim to investment gains directly or indirectly resulting from trading profits, investment management, or advisory fees obtained by following investment recommendations made, implied, or inferred by its research.
Investment involves risk, and all investments should be made with the supervision of a professional investment manager or advisor. The materials on the website are not an offer to sell or a solicitation of an offer to buy any investment, security, or commodity, nor shall any security be offered or sold to any person, in any jurisdiction in which such offer would be unlawful under the securities laws of such jurisdiction.
Country & Regions
- Kenya: Nairobi (Province)
Sector Classification
Transportation
Development need
Providing safe and affordable transportation is one of the key factors for enhanced, inclusive and sustainable urbanization and the achievement of SDG 11 - Sustainable Cities and Communities.(1) Transportation and storage make the highest contribution to the services sector and accounted for around USD 7.6 billion in 2019.(2)
Policy priority
In the SDG Readiness Report 2020, providing access to safe, affordable and sustainable transport systems for all by developing public transportation is an important target for achieving SDG 11 - Sustainable Cities and Communities.(26) Kenya is in the process of preparing a National Integrated Transport Policy and a Transport Master Plan to this effect.(1)
Gender inequalities and marginalization issues
Transportation is traditionally a male-dominated sector. Access to safe transportation options and mobility demonstrate gender inequalities, especially in Kenya's informal urban settlements.(21)
Investment opportunities introduction
Kenya’s rapid urbanization rate is 4.36% per annum. This creates ample opportunity to invest in transportation infrastructure and services given the rising demand.(3)
Key bottlenecks introduction
The main sector bottlenecks include the lack of capital, the poor quality of roads especially in rural areas, traffic congestion, difficulty in collecting tolls, the lack of a policy framework for attracting private investment and high fuel prices.
Land Transportation
Development need
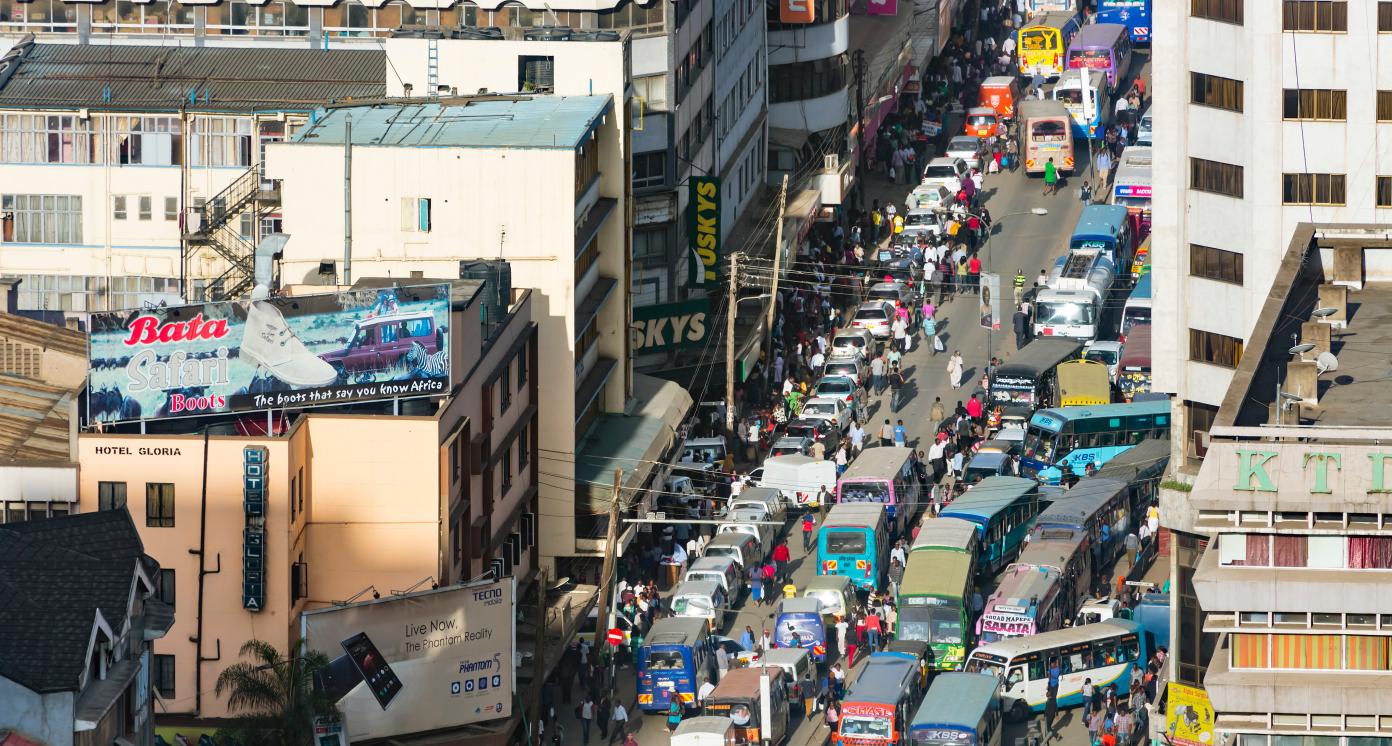
According to the SDG Report 2020, Kenya has major challenges in the number of traffic deaths and satisfaction with public transport.(4) The high population growth in Kenya puts a significant strain on urban services, including transport, affecting economic productivity and citizens' living standards.(5)
Road Transportation
Pipeline Opportunity
Public transportation
Establish efficient public bus transportation systems in the biggest cities and create linkages between city centers and suburban areas.
Business Case
Market Size and Environment
4.36% urbanization rate, motorized transport annual revenue of USD 386 - 420 million.
Kenya’s rapid urbanization rate of 4.36% per annum is putting pressure on already stretched public transportation systems.(3)
Estimates indicate motorized transport (matatu) operators in Kenya have annual revenues in the range of USD 386 - 420 million.(9)
Indicative Return
5% - 10%
According to case study analysis from Italy (Sorrento), an e-Mobility Bus Fleet investment would generate an internal rate of return (IRR) of 6.9% for a 10-year investment timeframe. (10)
The Bus Rapid Transport System (including infrastructure development) in Hanoi (Vietnam) achieved an internal rate of return of 6.0%, while the Second Ring Road (including road construction) achieved an IRR of 18.5%. (These results were reported in the implementation, completion and results report.) (11)
Investment Timeframe
Long Term (10+ years)
The public-private partnership (PPP) model presented for India had an estimated timeframe of 10 years.(12)
An Italian case study of e-Mobility Bus Fleet had an estimated 10-year investment timeframe.(10)
A case study from Vietnam was an ex-post economic analysis. The investment took 10 years.(11)
Ticket Size
> USD 10 million
Market Risks & Scale Obstacles
Lack of a policy framework, government initiatives and a limited regulatory framework (23)
Impact Case
Sustainable Development Need
Kenya's high population growth put a significant strain on urban services including transport, and affected economic productivity and living standards.(9)
Transforming the country into a middle income country requires improved access to public services.(10)
Currently, public transportation is a complex paratransit system where commercial operators (called 'matatus') dominate the market. However, the quantity of service supplied is inconsistent with the capacity and quality of the overstretched infrastructure.(5)
Gender & Marginalisation
Transportation is a traditionally male-dominated sector. Access to safe transportation options and mobility demonstrate gender inequalities, especially in Kenya's informal urban settlements.(21)
Expected Development Outcome
Reduced commuting time
Reduced transport prices
Reduced air pollution caused by cars
Gender & Marginalisation
Increased access to safe transport modes for women and low income communities
Primary SDGs addressed
9.1.2 Passenger and freight volumes, by mode of transport
4.89 million air passengers in 2017, 288 million rail passengers in 2010 (22)
N/A
11.2.1 Proportion of population that has convenient access to public transport, by sex, age and persons with disabilities
11.7.1 Average share of the built-up area of cities that is open space for public use for all, by sex, age and persons with disabilities
N/A
N/A
N/A
N/A
Secondary SDGs addressed
Directly impacted stakeholders
People
Indirectly impacted stakeholders
Corporates
Public sector
Outcome Risks
Risk of degraded air quality, risk of additional greenhouse gas emissions (14)
Degraded water resources (14)
Risk of noise and habitat loss and fragmentation (14)
Gender inequality and/or marginalization risk: The risk that transport rates become unaffordable to the local population if prices rise
Impact Risks
External risk: An increase in vehicular congestion and potential risk of environmental degradation need to be accounted for during the planning phase of the business.
Impact Classification
What
Establishing an efficient bus public transport system is likely to provide more reliable transport alternatives to the existing informal mechanism.
Who
Citizens of urban areas (primarily Nairobi metropolitan area) who are aggrieved due to the lack of affordable transport and high commuting costs.
Risk
An increase in vehicular congestion and potential risk of environmental degradation need to be accounted for during the planning phase of the business.
Impact Thesis
Increase the quality of life for Kenyan citizens who suffer from informal and unsafe transport modes.
Enabling Environment
Policy Environment
National Integrated Transport Infrastructure Policy: This policy has been in draft since 2009.(1)
The National Integrated Transport Policy, the 50-year Transport Master Plan and the 20-year Transport Master Plan have been in preparation for the past couple of years.(1)
Nairobi Metropolitan Area Transport Authority: This body supervises the transport sector in Nairobi.(8),(15)
Financial Environment
Financial incentives: Kenya is willing to improve and expand infrastructure networks. However, considering transport sector policies are still being developed, no incentives related directly to public transportation investments have been identified.(18)
Other incentives: Kenya offers a wear and tear allowance on machinery - Class I at 37.5% for heavy vehicles (e.g. buses).(19)
Regulatory Environment
Nairobi City County Public Road Transport and Traffic Management Bill: In 2017, Nairobi City County issued a Nairobi City County Public Road Transport and Traffic Management Bill establishing a Public Road Transport and Management Committee.
Nairobi City County Public Road Transport and Traffic Management Bill: This Bill provides basic regulations for licensing and operations within the county public transportation sector.(16)
Nairobi City Country Transport Act: This Act aims 'to make provisions for country roads, public road transport, traffic management, parking, street lighting and for connected purposes'.(17)
The responsible supervisory bodies are the Ministry of Transport and Infrastructure Development, the Ministry of Public Service Youth and Gender Affairs, and the National Transport and Safety Authority.
Marketplace Participants
Private Sector
Kenya Bus Service Management Ltd (KBSM), Kenya Bus Services Ltd (KBS), Modern Coast, Coast Bus, Ramboll Group A/S (implementation of a ‘Bus Rapid Transit system’ in Nairobi)
Government
Ministry of Transport, Infrastructure, Housing, Urban Development and Public Works (State department of Transport); National Transport Safety Authority (NTSA) of Kenya; Kenya Urban Roads Authority; Nairobi Metropolitan Area Transport Authority (NaMATA)
Multilaterals
World Bank (WB), European Investment Bank (EIB), African Development Bank (AfDB), KfW Development Bank, Stecol Corporation (investment project - Bus Rapid Transport System), Standard Chartered
Target Locations

Kenya: Nairobi (Province)
References
- (1) Kenya Association of Manufacturers (KAM) (2020). SDGs Readiness Report: A Policy, Legislative and Institutional Review of the 17 SDGs in Kenya. https://kam.co.ke/kam/wp-content/uploads/2020/05/SDGs-Readiness-Report-2020.pdf
- (2) Kenya National Bureau of Statistics (2020). Quarterly Gross Domestic Product Report – First Quarter. https://www.knbs.or.ke/?wpdmpro=quarterly-gross-domestic-product-report-first-quarter&wpdmdl=5953&ind=Ul8csrxqeTBNMidZyvE8iLiddV-cGGqQWfgmjJWgaRmLWCfZ61tquMMPmBFY4k-E5oklNyRoibW2ZYrHFakEng
- (3) Robinson, B. (2018). Nairobi, Kenya: Accelerating Change In The Transport Sector. TUMI/ICLEI. https://www.transformative-mobility.org/assets/publications/TUMI-winner_City-profile-and-story_Nairobi.pdf
- (4) Sachs, J., Schmidt-Traub, G., Kroll, C., Lafortune, G., Fuller, G., Woelm, F. (2020). The Sustainable Development Goals and COVID-19. Sustainable Development Report 2020. Cambridge: Cambridge University Press.
- (5) World Bank. Kenya: National Urban Transport Improvement Project. Implementation, Completion And Results Report. http://documents1.worldbank.org/curated/en/702181563299068935/pdf/Kenya-National-Urban-Transport-Improvement-Project.pdf
- (6) Kenya National Bureau of Statistics (2020). Kenya Economic Survey 2020. https://www.knbs.or.ke/?wpdmpro=economic-survey-2020
- (7) Republic of Kenya. Third Medium Term Plan 2018 – 2022 Transforming Lives: Advancing Socio-economic Development Through The 'Big Four'.
- (8) Construction Review Online (2020). Construction of Bus Rapid Transit (BRT) system in Kenya to begin next month. https://constructionreviewonline.com/news/kenya/kenya-construction-of-bus-rapid-transit-brt-system-to-begin-next-month/
- (9) Salon, D. and Gulyani, S. (2019). 'Commuting In Urban Kenya: Unpacking Travel Demand In Large And Small Kenyan Cities', MDPI, Sustainability, vol. 11. https://www.mdpi.com/2071-1050/11/14/3823
- (10) Cartenì, A., Henke, Il, Molitierno, C. and Di Francesco, L. (2020). Strong Sustainability in Public Transport Policies: An e-Mobility Bus Fleet Application in Sorrento Peninsula (Italy). https://doi.org/10.3390/su12177033
- (11) World Bank (2018). Implementation completion and results report: Hanoi urban transport development project. Report no: ICR00004011. http://documents1.worldbank.org/curated/ru/598911517844600614/Implementation-Completion-and-Results-Report-ICR-Document-01312018.docx
- (12) Asian Development Bank (2011). Tool Kit for Public–Private Partnerships in Urban Bus Transport for the State of Maharashtra, India. https://www.adb.org/sites/default/files/publication/28657/ppp-bus-transport.pdf
- (13) Hosa, S. and Magrinya, F. (2018). 'Patchwork In An Interconnected World: The Challenges Of Transport Networks In Sub-Saharan Africa', Transport Reviews vol. 38. https://www.tandfonline.com/doi/full/10.1080/01441647.2017.1414899
- (14) Demirel, H. (2008). 'Exploring Impacts of Road Transportation on Environment: a Spatial Approach, Desalination, 226(1–3). https://www.sciencedirect.com/science/article/abs/pii/S0011916408001604
- (15) Kenya Private Sector Alliance (2017). President signs executive order to set up Nairobi Metropolitan Area Transport Authority. https://kepsa.or.ke/president-signs-executive-order-to-set-up-nairobi-metropolitan-area-transport-authority/
- (16) Nairobi City County Public Road Transport And Traffic Management Bill. Nairobi City County. https://nairobiassembly.go.ke/ncca/wp-content/uploads/bills/2017/The-Nairobi-City-County-Public-Road-Transport-And-Traffic-Management-Bill-2017.pdf
- (17) Nairobi City County Transport Act 2019. http://nairobiassembly.go.ke/ncca/wp-content/uploads/bill/2020/Nairobi-City-County-Transport-Bill-2019.pdf
- (18) Kenya Investment Authority (2020). Infrastructure - Kenya Investment Authority. http://www.invest.go.ke/infrastructure/
- (19) KENIvest. Investment Incentives. http://www.invest.go.ke/starting-a-business-in-kenya/investment-incentives/
- (20) Salon, D. and Gulyani, S. (2019). 'Commuting In Urban Kenya: Unpacking Travel Demand In Large And Small Kenyan Cities', MDPI, Sustainability, vol. 11. https://www.mdpi.com/2071-1050/11/14/3823
- (21) Carter, L., Kishiue, A. and Dominguez Gonzalez, K. (2020). Gender in Urban Transport in Nairobi, Kenya : Volume 2. Employment. World Bank. https://openknowledge.worldbank.org/handle/10986/34610
- (22) SDG Tracker (2021). End poverty in all its forms everywhere. https://sdg-tracker.org/no-poverty