


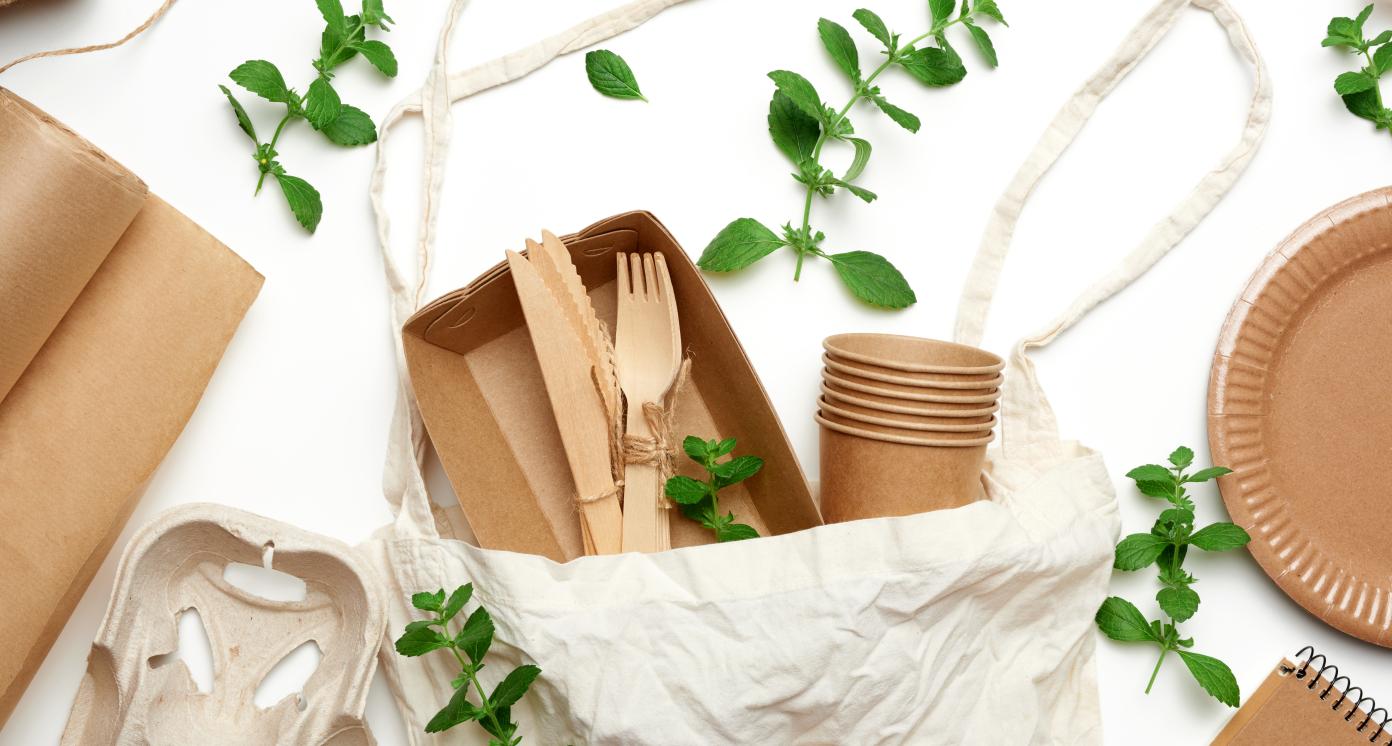
Production Of Sustainable Packaging, Including Using Biodegradable Materials
Production Of Sustainable Packaging, Including Using Biodegradable Materials
Business Model Description
Invest in B2B companies that develop solutions for manufacturers and retailers who are looking to minimize their environmental impact and offer eco-friendly products to their customers. This also includes B2C companies that develop solutions for environmentally conscious consumers who are willing to pay a premium for sustainable packaging. Revenue streams come from the sale of packaging materials, licensing of intellectual property, and provision of consulting services for clients looking to adopt more sustainable packaging solutions. Examples of companies active in this space are:
Green Eco Paradise produces sustainable packaging made from plant-based materials, such as cassava starch, cornstarch, and rice husks. Green Eco Paradise provides sustainable packaging solutions to B2B and B2C customers, including for events including recently at Universiti Teknologi Petronas (44).
Packaton is a leading paper bag manufacturer that produces biodegradable bags made with long fibers paper to ensure maximum strength. Packaton produces 80,000 paper bags a day through its rapid automated production line. Packaton provides sustainable packaging solutions to B2B and B2C customers (45).
Circlepac's products are made of renewable plant-based materials such as bamboo, bagasse, and FSC-certified birchwood. They are also certified compostable within 90-270 days. As of 2021, Circlepac catered to 68 customers that range from home businesses to 5-star hotels. Some of these establishments include TinyGreens, Omulab, Little People, and Mandarin Oriental KL (46).
Expected Impact
Decrease plastic pollution on land and in the oceans, reduce pressure on landfills, enhance the circular economy and improve an otherwise resource-intensive economy toward a more sustainable pathway.
How is this information gathered?
Investment opportunities with potential to contribute to sustainable development are based on country-level SDG Investor Maps.
Disclaimer
UNDP, the Private Finance for the SDGs, and their affiliates (collectively “UNDP”) do not seek or solicit investment for programmes, projects, or opportunities described on this site (collectively “Programmes”) or any other Programmes, and nothing on this page should constitute a solicitation for investment. The actors listed on this site are not partners of UNDP, and their inclusion should not be construed as an endorsement or recommendation by UNDP for any relationship or investment.
The descriptions on this page are provided for informational purposes only. Only companies and enterprises that appear under the case study tab have been validated and vetted through UNDP programmes such as the Growth Stage Impact Ventures (GSIV), Business Call to Action (BCtA), or through other UN agencies. Even then, under no circumstances should their appearance on this website be construed as an endorsement for any relationship or investment. UNDP assumes no liability for investment losses directly or indirectly resulting from recommendations made, implied, or inferred by its research. Likewise, UNDP assumes no claim to investment gains directly or indirectly resulting from trading profits, investment management, or advisory fees obtained by following investment recommendations made, implied, or inferred by its research.
Investment involves risk, and all investments should be made with the supervision of a professional investment manager or advisor. The materials on the website are not an offer to sell or a solicitation of an offer to buy any investment, security, or commodity, nor shall any security be offered or sold to any person, in any jurisdiction in which such offer would be unlawful under the securities laws of such jurisdiction.
Country & Regions
- Malaysia: Selangor
- Malaysia: Perak
- Malaysia: Johor
Sector Classification
Food and Beverage
Development need
Agriculture employs 1.86 million workers (44), grapples with social protection challenges. Malaysia's food trade deficit has surged from USD 371.87 million in 1988 to USD 4.57 billion (10). The late 2021 and early 2022 floods inflicted nearly RM 90.6 million (USD 19.62 million) in damages to the sector, underlining the need for enhanced resilience (45).
Policy priority
Under the 12th Malaysia Plan (1), Ministry of Agriculture and Food Security (MAFS) received USD 1.5 billion allocation, setting food security and agriculture as priorities. The 2021 NDCs' emphasizes on these sectors for GHG reduction (46), the First Policy Thrust of the 2021-2030 National Agrofood Policy (2) and 2021-2025 Food Security Plan aim for tech-driven transformations.
Gender inequalities and marginalization issues
Agriculture and food production significantly influence growth, vital for rural areas and smallholder farmers (16). Yet, challenges persist: 56 per cent of workers are non-standard, facing higher retrenchment risks, and over 30 per cent are underprotected foreign workers (45). Almost 90 per cent of agricultural establishments are vulnerable SMEs, including 40 per cent micro-enterprises, employing 42 per cent of the sector's workforce.
Investment opportunities introduction
Malaysia prioritizes food security and agriculture development, as RM5.38 billion is allocated to the Ministry of Agriculture and Food Security (MAFS) to address challenges in food production and supply (5). The food & Agri-Tech sector received USD 1.33 billion in start-up funding during Jan-Nov 2022 (4).
Key bottlenecks introduction
Malaysia remains vulnerable due to extreme weather conditions and climate change, resulting to drought in areas whereby cultivation of crops become unfeasible (11). The late 2021-early 2022 floods inflicted nearly RM 90.6 million (USD 19.62 million) in damages to the sector, due to climate change extreme weather condition is forecasted to bring more damages (47, 11).
Food and Agriculture
Development need
Malaysia had a trade surplus in plastic resin, exporting 3.5 million tonnes, importing 3.1 million tonnes in 2019. Consumption of key resin, primarily utilized for polyester and packaging purposes, amounted to 1. million tonnes. Given that 48 per cent of plastic end-use is for packaging, there is a pressing need to focus on the production of sustainable packaging materials (21).
Policy priority
Sustainable packaging is a policy priority in Malaysia, emphasized in the Plastics Sustainability Roadmap 2021 to 2030 (13), Roadmap Towards Zero Single-Use Plastics (2018-2030), affirming the 12th Malaysia Plan target of achieving a 40 per cent recycling rate. (1)
Gender inequalities and marginalization issues
In 2021, women accounted for 46.1 per cent of the workforce in the food and beverage sector. However, when it comes to high-skilled positions within the field, women represented only 23.7 per cent (41).
Investment opportunities introduction
High per capita plastic packaging consumption of around 16.78kg per person presents a significant market. Companies like Nestle adopting recycled PET (21) and MNCs within MAREA focusing on recycled and renewable materials demonstrate a clear demand. Meeting the national target of achieving 25 per cent plastic recycling rate by 2030 further drives prospects (19).
Key bottlenecks introduction
The potential premium cost associated with sustainable and biodegradable materials (31) and potential gaps between supply and demand for sustainable packaging materials. The uptake of sustainable packaging may be hindered by higher costs compared to conventional alternatives.
Processed Foods
Pipeline Opportunity
Production Of Sustainable Packaging, Including Using Biodegradable Materials
Invest in B2B companies that develop solutions for manufacturers and retailers who are looking to minimize their environmental impact and offer eco-friendly products to their customers. This also includes B2C companies that develop solutions for environmentally conscious consumers who are willing to pay a premium for sustainable packaging. Revenue streams come from the sale of packaging materials, licensing of intellectual property, and provision of consulting services for clients looking to adopt more sustainable packaging solutions. Examples of companies active in this space are:
Green Eco Paradise produces sustainable packaging made from plant-based materials, such as cassava starch, cornstarch, and rice husks. Green Eco Paradise provides sustainable packaging solutions to B2B and B2C customers, including for events including recently at Universiti Teknologi Petronas (44).
Packaton is a leading paper bag manufacturer that produces biodegradable bags made with long fibers paper to ensure maximum strength. Packaton produces 80,000 paper bags a day through its rapid automated production line. Packaton provides sustainable packaging solutions to B2B and B2C customers (45).
Circlepac's products are made of renewable plant-based materials such as bamboo, bagasse, and FSC-certified birchwood. They are also certified compostable within 90-270 days. As of 2021, Circlepac catered to 68 customers that range from home businesses to 5-star hotels. Some of these establishments include TinyGreens, Omulab, Little People, and Mandarin Oriental KL (46).
Business Case
Market Size and Environment
> USD 1 billion
< 5%
In 2021, 18.4 billion packaging units were distributed (14).
In 2021, 18.4 billion units were distributed in the country. The total untapped potential material value of recyclable plastics in Malaysia was US 1.1 billion, with a CAGR of 3 per cent between 2021 and 2026 (14, 19).
Depending on the size of order, complexity and urgency. Expert stakeholders have indicated per unit costs of F&B packaging can be in excess of USD 0.20 per unit for F&B containers.
Indicative Return
5% - 10%
Packaging companies mean gross profit margins/ operating margins - 9.5 per cent-13.66 per cent.
Stakeholder consultations showed that traditionally margins for plastic packaging are 5 per cent (50) An analysis of a selection of listed packaging companies yielded gross profit margins of 9.5 per cent to 13.66 per cent. The companies analyzed were Box-Pak Malaysia Bhd, Scientex Bhd and Scientex Packaging (Ayer Keroh) Bhd. (51, 52, 53)
Scientex was highlighted because it has also established more climate friendly packaging solutions.
For example, Scientex' manufactures fully compostable bioplastics, with a partnership such as its agreement with Sabic to develop flexible food packaging using post-consumer recycled ocean bound plastic (22, 23). Global Packaging IRRs as of 1H22 stood at 9.1 per cent (25).
2022 Median net IRRs for APAC PE funds stood at 15 per cent, with top quartile funds registering a net median IRR of 25 per cent. In 2020, IRRs in Southeast Asia based deals stood at 21.44 per cent (26, 27).
Investment Timeframe
Short Term (0–5 years)
50 per cent of Malaysia's plastic packaging has to be made out of bioplastics under the Malaysia Plastics Sustainability Roadmap 2021. Expert consultations have also stated that this can be done in the short term and yield returns amid the transition away from single use plastics.
Ticket Size
USD 1 million - USD 10 million
Market Risks & Scale Obstacles
Market - High Level of Competition
Business - Supply Chain Constraints
Impact Case
Sustainable Development Need
0.94 million tons of plastic waste are estimated to be mismanaged, of which 0.14 to 0.37 million tons may have been washed into the oceans (31). It takes up to 500 years for these plastic components to decompose (33).
Currently, plastic food packaging cannot be recycled in Malaysia because of the lack of technology and low recycling value. Additionally, biodegradable alternatives are more expensive than single-use packaging (31).
In Malaysia, 1.2 million tonnes of agricultural waste per year are disposed in landfills. Plastic waste is estimated to represent 17 per cent of the waste sent to landfills. On a circularity point, these might be used as potential raw material for sustainable packaging (34, 28).
Gender & Marginalisation
Coastal communities are particularly affected by plastic litter and pollution on the beaches eroding their living conditions and livelihoods (32).
In Malaysia, in 2021, 46.1 per cent of the food and beverage sector's workforce were women, however they represented 23.7 per cent only of the field high-skilled workers (41). Lack of their representation in technical and leadership positions affects the industry's ability to tackle environmental challenges (42).
Expected Development Outcome
Increased production of biodegradable and compostable packaging alternatives reduces the use of single-use plastics, thus contributing to the decrease in plastic pollution and waste pressure on landfills (31, 33, 34).
Use of Agri-waste for sustainable packaging contributes to an increased production chain circularity, a decrease in both the agricultural and the waste sectors' emissions, with a footprint potentially decreased up to 80 per cent (20, 43).
Zero-emission production processes exist for innovative sustainable packaging solutions, which can contribute to lowering GHG emissions caused by industrial production (33).
Gender & Marginalisation
Reduced production and use of conventional single-use plastic packaging will decrease marine plastic pollution (32), thus improving the environmental health for the coastal communities and their livelihoods.
Provided that a conductive environment for women in STEM education is put in place, enhancement of sustainable packaging production can increase employment of women in the industry, while contributing to the sustainable transformation of the agrifood sector (42).
Primary SDGs addressed
11.6.1 Proportion of municipal solid waste collected and managed in controlled facilities out of total municipal waste generated, by cities
38,427 metric tonnes of solid waste generated per day in 2021 (1.17 kg/capita/day) of which around 82.5 per cent disposed in landfills and 30.67 per cent recycled according to 2020 reports (29).
The objective is to reach 40 per cent of recycling for household waste and 35 per cent for scheduled waste by 2025 (1).
12.3.1 (a) Food loss index and (b) food waste index
12.5.1 National recycling rate, tons of material recycled
12.2.1 Material footprint, material footprint per capita, and material footprint per GDP
In 2019, the food waste per capita was 91.4 kg for households, 89.6 kg for out-of-home consumption, and 78.8 kg for retail (35).
31.52 per cent of waste in 2021 (40).
In 2017, 22.6 tonnes per capita (30).
The objective is to reach 40 per cent of recycling for household waste and 35 per cent for scheduled waste by 2025 (1).
15.3.1 Proportion of land that is degraded over total land area
15.22 per cent of land in 2019 (35).
Secondary SDGs addressed
Directly impacted stakeholders
People
Gender inequality and/or marginalization
Planet
Corporates
Public sector
Indirectly impacted stakeholders
People
Gender inequality and/or marginalization
Planet
Corporates
Public sector
Outcome Risks
Sustainable packaging production (e.g., if plant-based) might compete with agricultural production for access to and occupation of land.
If the disposal conditions for the sustainable packaging are not suitable for complete degradation or material recovery, the production might increase negative environmental impact (36).
If the affordability of sustainable packaging solutions is not considered, at the wholesale level or within the production chain, the final price might be prohibitive for the end consumer.
Gender inequality and/or marginalization risk: If sustainable packaging is expensive or non-incentivized, companies, especially SMEs, might not be able to transition towards these solutions.
Impact Risks
Stakeholder participation risk may occur if the developed packaging does not correspond to the expectations of the industries using them and is more expensive than plastic alternatives.
Impact Classification
What
The development of sustainable packaging decreases plastic pollution and pressure on landfills, contributing to a low-pollution economy.
Who
Owners and employees of packaging companies, people working in the industry needing packaging solutions, and general population.
Risk
Stakeholder participation risk due to not responding to the expectations of the industries using packaging solutions and/or higher costs compared to unsustainable options.
Contribution
Contribute to reducing the estimated 0.94 million tons of plastic waste which are mismanaged in Malaysia (31).
How Much
The World Bank estimated that Malaysia loses 81 per cent value of discarded recyclable plastic resins, worth USD 1.1 billion, every year (32).
Impact Thesis
Decrease plastic pollution on land and in the oceans, reduce pressure on landfills, enhance the circular economy and improve an otherwise resource-intensive economy toward a more sustainable pathway.
Enabling Environment
Policy Environment
Twelfth Malaysia Plan (2021-2025): the plan highlights the packaging industry as a transformative area to aim towards more sustainable development (1).
Malaysian Plastic Sustainability Roadmap (2021-2030): the roadmap highlights sustainable packaging as a solution to phase-out of the problematic plastic products (37).
Roadmap towards zero Single-Used Plastic (SUP) (2018-2030): the roadmap aims to implement a phased, evidence-based approach involving all stakeholders. It was the first roadmap of its kind in Malaysia, providing a policy direction in tackling SUP (13).
Industry4WRD Policy on Industry 4.0: The policy intends to support companies' digital transformation in manufacturing sector, including packaging and food manufacturing, through incentives and support for infrastructure, human capital and technology development (48).
Malaysia Madani: The Malaysia Madani plan has six main principles including Innovation and Sustainability, with aspirations of strengthening MSME resilience and prioritising food security (49)
Financial Environment
Fiscal incentives: Pioneer Status (MIDA) grants a 70 per cent tax exemption on statutory income for a period of 5 years (47)
Fiscal incentives: Investment Tax Allowance (ITA) provides allowance of 60 per cent of qualifying capital expenditure incurred within 5 years. It can be offset against 70 per cent of statutory income for each assessment year and the unutilized amount can be carried forward until fully absorbed (47)
Regulatory Environment
Food Regulations 1985: are regulating food labeling standards in Malaysia and require all packaged food products sold in the country to display a list of ingredients and nutritional information (39).
Halal Consumable Goods - General Requirements (MS2738:2021) (and Standards of Malaysia Act 1996): regulates the material, hygiene, sanitation and safety conditions of the production of consumable goods, including packaging, labelling and advertising (37).
Marketplace Participants
Private Sector
Bio-Lutions; Green Eco Paradise; Packaton; Circlepac; BioPak; MyPak Solutions; Biogreen Biotech; Bintang Capital Partners; RHL Ventures; 500 Durians.
Government
Ministry of Natural Resources, Environment and Climate Change (KeTSA); Ministry of Science Technology and Innovation (MOSTI); Ministry of Domestic Trade and Cost of Living (KPDN).
Multilaterals
United Nations Development Programme (UNDP); World Bank; United Nations Environment Programme (UNEP); United Nations Industrial Development Organization (UNIDO); Global Environment Facility (GEF).
Non-Profit
Malaysian Plastics Manufacturers Association (MPMA); Malaysian Timber Industry Board (MTIB); Malaysian Biotechnology Corporation (Biotech Corp); Malaysian Packaging Industry Association (MPIA).
Public-Private Partnership
Malaysia Digital Economy Corporation (MDEC); Malaysian Industry-Government Group for High Technology (MIGHT); Malaysian Global Innovation & Creativity Centre (MaGIC); Malaysia Co-Investment Fund (MyCIF).
Target Locations

Malaysia: Selangor
Malaysia: Perak
Malaysia: Johor
References
- (1) Prime Minister’s Department of Economy, Economic Planning Unit. 2021. Twelfth Malaysia Plan (12MP) 2021-2025 : A Prosperous, Inclusive, Sustainable Malaysia. https://rmke12.epu.gov.my/en.
- (2) Ministry of Agriculture and Food Industries. 2022. Executive Summary National Agrofood Policy 2021-2030. https://issuu.com/dan2.0english/docs/executive_summary_national_agrofood_policy_2021-20.
- (3) National Food Security Policy Action Plan (DSMN) 2021-2025
- (4) Teacxn. SEA Tech Annual Funding Report. https://tracxn.com/d/reports-geo-annual/sea-tech-annual-funding-report/__auDrOmG0P4ufw4CH0xOfqF4b1A8e1zt8YAA1d0MlEXE.
- (5) MOF. 2023. Budget 2023 Speech. https://budget.mof.gov.my/pdf/belanjawan2023/ucapan/ub23-BI.pdf.
- (6) NCER Strategic Development Plan 2021 – 2025. https://www.ncer.com.my/wp-content/uploads/2021/02/NCER_Strategic-Development-Plan.pdf
- (7) TNB. Pricing & Tariffs For Industrial Consumers. https://www.tnb.com.my/commercial-industrial/pricing-tariffs1.
- (8) The Edge Malaysia. 2022. Time of reckoning for energy-intensive industries as electricity surcharge rises. https://www.theedgemarkets.com/article/time-reckoning-energyintensive-industries-electricity-surcharge-rises.
- (9) MIDA. Incentives for New investment. https://www.mida.gov.my/wp-content/uploads/2020/07/Chapter-2-Incentives-for-New-Investments.pdf.
- (10) Deloitte. 2021. Emerging Tech & Innovation in Malaysia's Agriculture Landscape. https://assets.website-files.com/5e203b2a5cacb3352dee21e4/60e2cd0c4b6c7c74273ee24d_Agriculture%20paper%20with%20MaGIC_v5.pdf.
- (11) Alam et al 2011. Impacts of Climate Change on Agriculture and Food Security Issues in Malaysia: An Empirical Study on Farm Level Assessment, World Applied Sciences Journal, Vol. 14(3), pp. 431-442. www.idosi.org/wasj/wasj14(3)11/12.pdf
- (12) The Economy Impact. Global Food Security Index. https://impact.economist.com/sustainability/project/food-security-index/.
- (13) Ministry of Energy, Science, Technology, Environment & Climate Change (MESTECC). 2018. Malaysia's Roadmap towards Zero Single-Use Plastics 2018-2030. https://www.pmo.gov.my/ms/2019/07/pelan-hala-tuju-malaysia-ke-arah-sifar-penggunaan-plastik-sekali-guna-2018-2030/.
- (14) Global Data. 2022. Malaysia Packaging Market Size, Analysing Key Pack Material (Pack Type, Closure Material and Type, Primary Outer Material and Type), Innovations and Forecast, 2021-2026. https://www.globaldata.com/store/report/malaysia-packaging-market-analysis/.
- (15) Ministry of Environment of Water Malaysia. 2021. Malaysia Plastics Sustainability Roadmap 2021 to 2030. https://www.kasa.gov.my/resources/alam-sekitar/MALAYSIA-PLASTICS-SUSTAINABILITY-ROADMAP-2021-2030.pdf.
- (16) Baker Mckenzie. 2021. AgriTech - a promising response to climate change. https://insightplus.bakermckenzie.com/bm/attachment_dw.action?attkey=FRbANEucS95NMLRN47z%2BeeOgEFCt8EGQJsWJiCH2WAVfnLVn2ghRGII%2FOblwHW3C&nav=FRbANEucS95NMLRN47z%2BeeOgEFCt8EGQbuwypnpZjc4%3D&attdocparam=pB7HEsg%2FZ312Bk8OIuOIH1c%2BY4beLEAe2Ai%2B9k3Gy7s%3D&fromContentView=1.
- (17) GSMA. 2022. Reaching and Empowering Women with Digital Solutions in the Agricultural Last Mile. https://www.gsma.com/mobilefordevelopment/wp-content/uploads/2022/05/Agri-Women-in-Value-Chains-v5.pdf.
- (18) MGTC. 2022. Green Investment Tax Allowance (GITA) & Green Income Tax Exemption (GITE). https://www.mgtc.gov.my/what-we-do/green-incentives/green-investment-tax-incentives-gita-gite/.
- (19) Ministry of Environment of Water Malaysia. 2021. Malaysia Plastics Sustainability Roadmap 2021 to 2030. https://www.kasa.gov.my/resources/alam-sekitar/MALAYSIA-PLASTICS-SUSTAINABILITY-ROADMAP-2021-2030.pdf.
- (21) The Edge Malaysia. 2022. Scientex's Insatiable Appetite for acquisitions. https://www.scientex.com.my/wp-content/uploads/2022/02/Scientexs-relentless-pursuit-of-growth.pdf.
- (22) Scientex Bhd. 2023. Fully Compostable BioPBS. https://www.scientex.com.my/product/consumer-packaging/fully-compostable-biopbs/.
- (23) SABIC. 2022. SABIC enables Scientex Group in developing world's first PP flexible food packaging using post consumer recycled (PCR) oceam bound plastic. https://www.sabic.com/en/news/38367-sabic-enables-scientex-in-developing-worlds-first-pp-flexible-food-packaging.
- (24) BusinessToday. 2020. VentureTECH to invest RM10 million in Gaia Plas Bhd to provide end-to-end solution for all packaging products. https://www.businesstoday.com.my/2020/12/22/venturetech-to-invest-rm10-million-in-gaia-plas-bhd-to-provide-end-to-end-solution-for-all-packaging-products/.
- (25) Ernst & Young. 2022. Packaging Market Update. https://assets.ey.com/content/dam/ey-sites/ey-com/en_ca/topics/strategy-transactions/ey-packaging-recap-q2-2022.pdf.
- (26) Bain and Company. 2023. Asia-Pacific Private Equity Report 2023. https://www.bain.com/insights/asia-pacific-private-equity-report-2023.
- (27) Hydra Strategy Limited. 2021. Efront releases fourth annual global private equity performance series. http://www.hydrastrategy.co.uk/blog/2021/8/24/efront-gpeps-2021.
- (28) FFTC Agricultural Policy Platform. 2021. The Challenges in Repurposing Food Wastes and Other Residuals for Agriculture. https://ap.fftc.org.tw/article/2785.
- (29) MIDA. 2021. Waste to Energy for a Sustainable Future. https://www.mida.gov.my/waste-to-energy-for-a-sustainable-future/.
- (30) Statista. 2017. Material footprint per capita in Malaysia from 2005 to 2017. https://www.statista.com/statistics/687338/malaysia-material-footprint-per-capita/.
- (31) Ministry of Energy, Science, Technology, Environment & Climate Change (MESTECC). 2018. Malaysia's Roadmap towards Zero Single-Use Plastics 2018-2030. https://www.pmo.gov.my/ms/2019/07/pelan-hala-tuju-malaysia-ke-arah-sifar-penggunaan-plastik-sekali-guna-2018-2030/.
- (32) Packaging Gateway. 2022. MAREA collaborative approach aligns with 90% of Malaysians who prioritise recycling. https://www.packaging-gateway.com/comment/marea-malaysians-prioritise-recycling/.
- (33) NC State University. 2022. New Biomaterial Could Save Our Oceans From Plastic Pollution. https://cnr.ncsu.edu/news/2022/03/new-biomaterial-plastic-pollution/.
- (34) New Straits Times. 2022. Can Malaysia achieve 40 per cent recycling rate by 2025?. https://www.nst.com.my/news/nation/2022/03/778625/can-malaysia-achieve-40-cent-recycling-rate-2025.
- (35) UN Department of Economic and Social Affairs. 2022. SDG Indicators Database. https://unstats.un.org/sdgs/dataportal/database.
- (36) WWF. 2022. Is biodegradable and compostable plastic good for the environment? Not necessarily. https://www.worldwildlife.org/blogs/sustainability-works/posts/is-biodegradable-and-compostable-plastic-good-for-the-environment-not-necessarily.
- (37) Department of Standards. 2021. Draft Malaysian Standards, Halal Consumable Goods – General Requirements. https://upc.mpc.gov.my/csp/sys/bi/%25cspapp.bi.viewfile.cls?upcAttId=11598.
- (38) Ministry of Environment & Water. 2021. Malaysia Plastic Sustainability Roadmap 2021-2030. https://www.kasa.gov.my/resources/ebook/MALAYSIA_PLASTICS_SUSTAINABILITY_ROADMAP_2021-2030.pdf.
- (39) Government of Malaysia. 1985. Law of Malaysia, P.U.(A) 437 of 1985, Food Act 1983, Food Regulations 1985. https://importlicensing.wto.org/sites/default/files/members/91/Regulation%20No.437%20-%20Food%201985_01.01.2014.pdf.
- (40) MIDA. The Preffered Approach for Waste Management in Malaysia. https://www.mida.gov.my/waste-to-energy-wte-the-preferred-approach-for-waste-management-in-malaysia/.
- (41) DOSM. 2022. Annual Economics Statistics 2022, Food and Beverage Sercices. https://www.dosm.gov.my/uploads/release-content/file_20230302140224.pdf.
- (42) Packaging Gateway. 2023. Women at the forefront of the packaging industry reveal how to achieve gender equality. https://www.packaging-gateway.com/interviews/women-at-the-forefront-of-the-packaging-industry-reveal-how-to-achieve-gender-equality/.
- (43) BioPak. Why We Design Packaging for the Circular Economy. https://www.biopak.com/au/about/sustainability.
- (20) Ministry of Natural Resources, Environment and Climate Change. 2022. Malaysia’s Fourth Biennial Update Report. https://unfccc.int/sites/default/files/resource/MY%20BUR4_2022.pdf.
- (21) Neo. 2023. Sustainability amid volatility: Nestle Malaysia pushes energy, packaging and plant-based progress despite economic uncertainty, Food Navigator Asia https://www.foodnavigator-asia.com/Article/2023/03/20/nestle-malaysia-pushes-energy-packaging-and-plant-based-progress-despite-economic-uncertainty.
- (44) Green Eco Paradise. 2023. Biodegradable Party Plates For Universiti Teknologi Petronas (UTP) Hari Raya 2023. https://www.greenecoparadise.com/biodegradables/biodegradable-party-plates/
- (45) Packaton. 2023. Packaton. https://www.packaton.com/.
- (46) Vulcan Post. 2021. They’re Tackling The Big Plastic Waste Issue As Food Deliveries Rise Again Under MCO 2.0. https://vulcanpost.com/730243/circlepac-compostable-eco-friendly-food-packaging-malaysia/
- (47) MIDA. 2020. Incentives for New Investment. https://www.mida.gov.my/wp-content/uploads/2020/07/Chapter-2-Incentives-for-New-Investments.pdf
- (48) Government of Malaysia. Industry4WRD Policy. 2018. https://www.miti.gov.my/index.php/pages/view/4832
- (49) Government of Malaysia. Economic & Fiscal Outlook and Federal Government Revenue Estimates 2023. 2023. https://budget.mof.gov.my/pdf/belanjawan2023/ekonomi-fiskal/EUFORE2023_270223.pdf
- (50) Malaysian Investment Development Authority, Advisory Panel Meeting, June 9, 2023
- (51) Scientex Bhd Financial Results. Bursa Malaysia. Accessed in April 2023. https://www.bursamalaysia.com/market_information/announcements/company_announcement
- (52) Scientex Packaging (Ayer Keroh) Bhd, Bursa Malaysia. Accessed in April 2023. https://www.bursamalaysia.com/market_information/announcements/company_announcement
- (53) Box-Pak (Malaysia) Bhd. Bursa Malaysia. Accessed in April 2023. https://www.bursamalaysia.com/market_information/announcements/company_announcement