


Mobile Payment Technologies & Services
Mobile Payment Technologies & Services
Business Model Description
Invest in or develop fintech services such as business-to-business (B2B) and business-to-consumer (B2C) mobile money transfer systems offering digital mobile money platforms, peer to peer money transfers, remittance transfers, bill payments and access to quick loans.
Expected Impact
Increase financial inclusions and provide payment and marketplace solutions to unbanked populations and businesses.
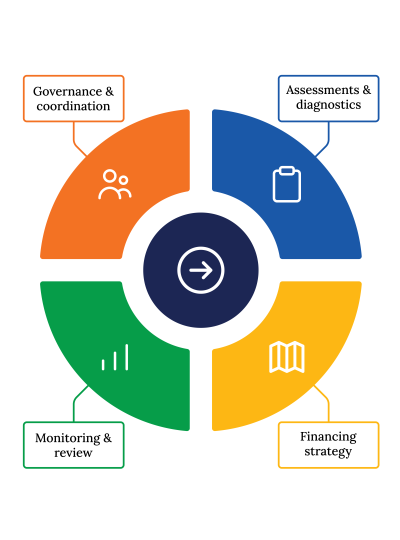
How is this information gathered?
Investment opportunities with potential to contribute to sustainable development are based on country-level SDG Investor Maps.
Disclaimer
UNDP, the Private Finance for the SDGs, and their affiliates (collectively “UNDP”) do not seek or solicit investment for programmes, projects, or opportunities described on this site (collectively “Programmes”) or any other Programmes, and nothing on this page should constitute a solicitation for investment. The actors listed on this site are not partners of UNDP, and their inclusion should not be construed as an endorsement or recommendation by UNDP for any relationship or investment.
The descriptions on this page are provided for informational purposes only. Only companies and enterprises that appear under the case study tab have been validated and vetted through UNDP programmes such as the Growth Stage Impact Ventures (GSIV), Business Call to Action (BCtA), or through other UN agencies. Even then, under no circumstances should their appearance on this website be construed as an endorsement for any relationship or investment. UNDP assumes no liability for investment losses directly or indirectly resulting from recommendations made, implied, or inferred by its research. Likewise, UNDP assumes no claim to investment gains directly or indirectly resulting from trading profits, investment management, or advisory fees obtained by following investment recommendations made, implied, or inferred by its research.
Investment involves risk, and all investments should be made with the supervision of a professional investment manager or advisor. The materials on the website are not an offer to sell or a solicitation of an offer to buy any investment, security, or commodity, nor shall any security be offered or sold to any person, in any jurisdiction in which such offer would be unlawful under the securities laws of such jurisdiction.
Country & Regions
- Eswatini: Shiselweni
- Eswatini: Lubombo
Sector Classification
Financials
Development need
Financial inclusion in Eswatini has increased to 87%, yet inequalities remain. Low-income individuals and MSMEs, especially in the informal sector forming 80% of the labor market in 2018, confront difficulties in accessing financial services and credit. Limited infrastructure also constrains rural people's access to finance (1).
Policy priority
The National Financial Inclusion Strategy (2017- 2022) sets priorities to deepen financial inclusion and expand formal products. The National Development Plan 2019-2022 outlines an economic recovery based on inclusive and sustainable growth and creating an conducive environment for an export-oriented and employment-creating private sector (3, 4).
Gender inequalities and marginalization issues
Women have fewer opportunities in the formal economy, with only 20% of women-owned businesses formally registered. Merely 48% women have access to formal financial services, as opposed to 56% of men (1). The youth unemployment rate reached 46% in 2019 with only 17% formally employed (1), creating more financial exclusion at 17%, compared to 13% of adults (1).
Investment opportunities introduction
Opportunities exist in digitizing cash transfer programmes, incorporating information on MSMEs and providing credit risk information, diversifying financial instruments and implementing collaborations between banks and microfinance institutions as in the case of the central bank's credit guarantee schemes (44).
Key bottlenecks introduction
Challenges in financial inclusion relate to irregular income streams for low-income households; lack of a robust credit information system; limited infrastructure in rural areas; weak consumer protection and regulatory frameworks; limited access to financial services and credit for the informally employed; and lack of financial literacy (5).
Corporate and Retail Banking
Development need
Limited competition in Eswatini's banking sector results in high charges and low accessibility with only 52% of adults holding a bank account (7). Low income individuals, MSMEs and smallholder farmers lack access to credit from commercial banks due to limited collateral and transactional records, and 90% of MSMEs start their business with informal credit (7).
Policy priority
The Eswatini National Payment System Vision and Strategy Document 2021–2025 emphasizes improving digital payment services (9). Eswatini's Small, Micro and Medium Enterprise Policy (2018) targets include strengthening legislative and regulatory frameworks for MSMEs, supporting MSMEs owned by women and young people, and enhancing the competitiveness of MSMEs (1).
Gender inequalities and marginalization issues
Only 49% of women have bank accounts compared to 52% of men, while 47% of young adults were banked compared to 52% overall (1). While 65% of MSME are owned by women, only 13% of female business owners can access formal credit, compared to 19% for male owners (1).
Investment opportunities introduction
Opportunities exist in enhancing competitiveness and accessibility of Savings and Credit Cooperatives (SACCOs); supporting businesses in the informal sector with access to affordable credit, especially in rural areas; and developing technologies and ICT infrastructure to increase the use of e-money and to reduce remittance costs.
Key bottlenecks introduction
Challenges exist in mobile payments and services related to interoperability across banking and mobile payment systems (1), unfamiliarity and limited trust of consumers in technology, limited personal transaction cap reaching E 4,000 (USD 265), and inconsistencies in accessing mobile money services (5).
Consumer Finance
Pipeline Opportunity
Mobile Payment Technologies & Services
Invest in or develop fintech services such as business-to-business (B2B) and business-to-consumer (B2C) mobile money transfer systems offering digital mobile money platforms, peer to peer money transfers, remittance transfers, bill payments and access to quick loans.
Business Case
Market Size and Environment
USD 100 million - USD 1 billion
> 25%
723,083 adults use mobile money in Eswatini
In 2021, the total value of transactions made on mobile money platforms grew by 44.6% year-on-year. The overall mobile money transactions volume throughout the year ending June 2021 amounted to 9,071,786 with a value of E 1.84 billion (USD 121.8 million) (29).
66% of the population in Eswatini choose mobile money as a financial channel. 54,000 adults (16% of the adult population) use their mobile money account to save. In terms of transfer payment methods, the most common and most used method was transfer by mobile phone (82%) (18).
GSMA's global mobile money metric categorizes Eswatini as a very high prevalent country for mobile money adoption, with the total adult population (15+) using mobile money reaching 723,083 in 2020 (25).
Indicative Return
< 5%
A mobile money transfer service in Eswatini recorded a gross profit margin of 1.5-5% (39). MoMo, MTN Eswatini’s mobile money service, recorded a year-to-year growth rate of 27.9% (19).
Investment Timeframe
Short Term (0–5 years)
For mobile service operators who have established a strong IT software and service offering, investments in mobile payment technologies and services in new regions are expected to generate return in a short timeframe given low capital requirements (39).
However, for new entrants to gain benefits of scale, mobile payment providers must invest with long time horizons. Providers will not be able to unlock the mobile money opportunity through incremental action, and partnerships are recommended to overcome regulatory hurdles (37).
Ticket Size
USD 1 million - USD 10 million
Market Risks & Scale Obstacles
Business - Supply Chain Constraints
Capital - CapEx Intensive
Market - High Level of Competition
Market - Highly Regulated
Impact Case
Sustainable Development Need
Majority of Eswatini's economic activity is concentrated in the informal sector with only 20% of the population formally employed (18). Merely 54% of the population is banked, with 9% relying on informal solutions and 27% excluded from any financial service (5).
Access to financial services for low-income individuals, micro, small and medium enterprises (MSMEs), and smallholder farmers is limited due to high collateral requirements. 90% of MSMEs start their business using informal financial sources, including personal savings and loans from family and friends (7).
The usage of formal financial services in the country increased by 21% from 2014 to 2018, driven primarily by the uptake of mobile money services, which reduce transaction costs and increase transparency of payments both domestically and across borders (18).
Gender & Marginalisation
Women are less able to participate in the formal economy and access formal financial products, with 48% of women using formal financial services compared to 56% of men. Only 20% of women-owned businesses in Eswatini are formally registered compared to 35% of those owned by men (18).
Women and young people have lower rates of access to banking services. Only 49% of women have bank accounts, compared to 52% of men, and 47% of young adults were banked, compared to 52% of the overall population (18).
Expected Development Outcome
Mobile payment systems support equal access to transparent, affordable and technology-backed platforms for low-income households and in underserved regions in Eswatini (21). Access to financial services has increased to 87% in 2021 compared to 50% in 2011, largely driven by mobile money uptakes (18), which has potential for further growth and additional impact.
Mobile payment technologies and services reduce operational costs for small businesses, which leads to increased revenues. They also facilitate access to e-commerce platforms through online payment schemes, which provides additional market opportunities for MSMEs.
Mobile payment systems result in lower transactions costs, improved access to underserved areas and higher levels of customer convenience (40).
Gender & Marginalisation
Mobile payment technologies and services reduce increase inclusion of women and youth to formal financial services, and financially empower women-owned businesses, which are primarily microenterprises operating in informal markets.
Primary SDGs addressed
8.10.2 Proportion of adults (15 years and older) with an account at a bank or other financial institution or with a mobile-money-service provider
52% of the adults are banked and 67% of adults have a mobile money account. 87% of the population is financially included, 85% of which are use formal financial products (6).
The National Financial Inclusion Strategy targets to reach 75% of adults with access to two or more formal financial products and reduce the percentage of financially excluded people to 15% by 2022 (23).
10.c.1 Remittance costs as a proportion of the amount remitted
In 2019, the average remittance costs as a proportion of the amount remitted was 18.21% (32).
Globally, reduce the transaction costs of migrant remittances to less than 3% and eliminate remittance corridors with costs higher than 5% by 2030 (43).
9.3.2 Proportion of small-scale industries with a loan or line of credit
9.3.1 Proportion of small-scale industries in total industry value added
46.86% in 2016 (30).
Proportion of businesses that are MSMEs 10% (2017) (31).
Reduce the proportion of emerging business owners who do not save from 17% in 2017 to 8% by 2025 (31).
Target to increase proportion of MSMEs to 30% by 2025 (31).
Secondary SDGs addressed
Directly impacted stakeholders
People
Gender inequality and/or marginalization
Corporates
Public sector
Indirectly impacted stakeholders
People
Planet
Corporates
Public sector
Outcome Risks
If not managed well, the mobile payment systems may carry cybersecurity risks associated with increased transaction volumes and insufficient recording capacity, which may lead to data breaches (33).
Given the dominance of a few large players, challenges within a single provider may disrupt the entire digital financial system, especially when it is difficult for other payment providers to fill the gap (33).
The digitalization of payment systems may create or exacerbate digital divides based on education levels, age and access to infrastructure.
Impact Risks
If financially excluded population groups are unable to access the mobile payment systems, for example due to lack of internet connectivity or unaffordability of transaction costs, the expected impact may be limited.
The lack of robust credit information and poor infrastructure for data collection may hinder recording the impact of mobile payment and e-wallet services (23).
Impact Classification
What
Mobile payment technologies and services increases financial inclusion and provides economic opportunities for previously excluded population groups and businesses.
Who
Financially excluded and unbanked populations, especially low-income individuals, and MSMEs in the informal sector and in rural areas benefit from mobile payment technologies and services.
Risk
If not managed well, mobile money could pose cybersecurity, data and technology risks as well as excluding the population who don't have access to mobile network or internet services
How Much
Mobile payment technologies and services address the 48% of the population that remains unbanked (6).
Impact Thesis
Increase financial inclusions and provide payment and marketplace solutions to unbanked populations and businesses.
Enabling Environment
Policy Environment
National Financial Inclusion Strategy for Swaziland, 2017-2022: The strategic objectives include expanding e-money services for transactions and savings and reducing remittance costs for vulnerable dependent groups through mobile products (23).
Eswatini National Payment System Vision and Strategy Document, 2021-2025: The strategic objectives include digitalization of payment systems by expanding the use of e-money and by digitalizing merchant payments (24).
Financial Sector Development Implementation Plan, 2017: Aims to establish a stable, diversified and modern financial system to increase financial inclusion. Mobile money and e-wallet accounts are provided as examples for existing digital financial services (41).
Financial Environment
Fiscal incentives: The government provides tax allowances and deductions for new enterprises, including a 10-year exemption from withholding tax on dividends and a low corporate tax of 10% for approved investment projects, including for mobile payment technologies and services (35).
Other incentives: Central Bank of Eswatini (CBE) created the FinTech Regulatory Sandbox to live test innovative financial products, services and business models in a controlled environment, allowing fintech startups, financial institutions and firms to test their products with relaxed regulations; CBE will engage with these entities to inform the required regulatory reforms (28).
Regulatory Environment
Minimum Standards for Electronic Payment Schemes (MSEPS), 2010: The Central Bank of Eswatini adopted MSEPS to develop viable alternatives to cash and to provide suitable risk-mitigated electronic payment options for those with no or limited access to financial services (26).
Practice Note for Mobile Money Providers, 2019: Issued by the Central Bank of Eswatini, it sets out requirements for the authorization and licensing of mobile money service providers and their agents (27).
Consumer Credit Act, 2016: Includes provisions for credit and consumer protection detailing who can apply for credit, the prohibited practices, and regulations regarding fees and charges (36).
Communications Commission Act, 2013: Provides the regulatory functions of the Eswatini Communications Commission (ESCCOM) with regard to electronic communications, data protection in electronic communications, postal services, electronic commerce and broadcasting (42).
Marketplace Participants
Private Sector
MTN Eswatini, Eswatini Mobile, Instacash, Eswatini Bank, Standard Bank, Mukuru.
Government
Ministry of Finance, Central Bank of Eswatini, Center for Financial Inclusion, Financial Services Regulatory Authority (FSRA), E-Government Unit, Ministry of Trade and Industry, Eswatini Communications Commission (ESCCOM), Centre for Financial Regulation and Inclusion (CENFRI).
Multilaterals
GSM Association (GSMA), The Financial Sector Reform and Strengthening (FIRST) Initiative, World Bank Group (WBG).
Target Locations

Eswatini: Shiselweni
Eswatini: Lubombo
References
- (1) Finmark Trust. 2020. Financial Inclusion Refresh. https://finmark.org.za/system/documents/files/000/000/391/original/Eswatini_Financial_Inclusion_Refresh.pdf?1614849476
- (2) UNDP Eswatini. About Eswatini. https://www.sz.undp.org/content/eswatini/en/home.html
- (3) Ministry of Finance. 2017. National Financial Inclusion Strategy for Swaziland 2017-2022. https://www.afi-global.org/publications/national-financial-inclusion-strategy-for-swaziland-2017-2022/
- (4) Ministry of Economic Planning and Development. 2019. National Development Plan 2019/2020-2021/2022. https://www.gov.sz/images/CabinetMinisters/NDP-2019-20-to-2021-22-final.pdf
- (5) Ministry of Finance. National Financial Inclusion Strategy for Swaziland 2017-2022. 2017. https://www.afi-global.org/publications/national-financial-inclusion-strategy-for-swaziland-2017-2022/
- (6) UNCDF. 2021. Measuring Progress: Financial Inclusion in Selected SADC Countries. https://www.uncdf.org/article/7365/measuring-progress-2021-financial-inclusion-in-selected-sadc-countries
- (7) Deputy Prime Ministers Office. 2019. The Kingdom of Eswatini's Country Progress Report on the Implementation of the Beijing Declaration and Platform for Action. https://archive.uneca.org/sites/default/files/uploaded-documents/Beijing25/eswatini-beijing25_report.pdf
- (8) Ministry of Economic Planning and Development. 2019. National Development Plan 2019/2020 - 2021/2022. https://www.gov.sz/images/CabinetMinisters/NDP-2019-20-to-2021-22-final.pdf
- (12) MTN Momo. https://www.mtn.co.sz/momo/
- (13) Eswatini Mobile. https://eswatinimobile.co.sz/e-mali/
- (14) Instacash. https://www.instacash.co.sz/about
- (15) Unayo. https://www.unayo.standardbank.com/static_file/unayo/
- (16) MTN Group Limited Quarterly update for the period ended 30 September 2021. https://www.mtn.com/wp-content/uploads/2021/11/MTN-Group-Q3-2021-JSE-SENS-announcement.pdf
- (17) Eswatini Observer. 2021. http://new.observer.org.sz/details.php?id=15902#:~:text=At%2010%20years%20since%20its,500%20new%20subscribers%20each%20month
- (18) Finmark Trust. 2020. Financial Inclusion Refresh. https://finmark.org.za/system/documents/files/000/000/391/original/Eswatini_Financial_Inclusion_Refresh.pdf?1614849476
- (19) MTN Group Results. 2021. https://www.mtn.com/wp-content/uploads/2021/08/MTN-Group-H1-21-results-presentation-2.pdf
- (20) Sustainable Development Report. https://dashboards.sdgindex.org/static/profiles/pdfs/SDR-2021-eswatini.pdf
- (21) Brookings Institution. July 2016. Ending Poverty with Electronic Payments. https://www.brookings.edu/wp-content/uploads/2016/07/FayeNiehausEndingPovertywithElectronicPayments.pdf
- (22) Kingdom of Eswatini. 2019. Voluntary National Review Report. https://sustainabledevelopment.un.org/content/documents/24651Eswatini_VNR_Final_Report.pdf
- (23) Minister of Finance. 2017. National Financial Inclusion Strategy. https://www.afi-global.org/publications/national-financial-inclusion-strategy-for-swaziland-2017-2022/
- (24) Central Bank of Eswatini. 2021. Eswatini National Payment System Vision and Strategy Document 2021–2025. https://cenfri.org/wp-content/uploads/Eswatini-National-Payment-System-Vision-2025.pdf
- (25) GSMA Index.Mobile Money Metrix. 2020. https://www.gsma.com/mobilemoneymetrics/#prevalence-index
- (26) Central Bank of Eswatini. 2010. Minimum Standards for Electronic Payments. https://www.centralbank.org.sz/national-payment-systems/
- (27) Central Bank of Eswatini. 2019. Proactive Note for Mobile Money Service Providers. https://www.centralbank.org.sz/national-payment-systems/
- (28) Central Bank of Eswatini. FinTech Sandbox. https://www.centralbank.org.sz/cbe-fintech-sandbox/
- (29) Central Bank of Eswatini. 2021. Financial Stability Report. Issue.5. https://www.centralbank.org.sz/financial-stability-report/
- (30) United Nations Statistics Division. 2020. SDG Indicators Database. https://unstats.un.org/sdgs/UNSDG/countryprofiles/SWZ#goal-9
- (31) United Nations Eswatini. United Nations Sustainable Development Cooperation Framework (UNSDCF) 2021-2025. https://unsdg.un.org/sites/default/files/2020-11/Eswatini_UNSDCF_2021%20to%202025_1.pdf
- (32) United Nations. 2021. SDG Indicators Database. https://unstats.un.org/sdgs/UNSDG/IndDatabasePage
- (33) International Monetary Fund. 2020. Mobile Money in the COVID-19 Pandemic. https://www.imf.org/~/media/Files/Publications/covid19-special-notes/en-special-series-on-covid-19-mobile-money-in-the-covid-19-pandemic.ashx?la=en
- (34) UNDP and UNCDF. 2021. Technical Paper 1.1. BigFinTechs and their impact on Sustainable Development. https://www.undp.org/sites/g/files/zskgke326/files/2021-06/UNDP-UNCDF-TP-1-1-BigFintechs-and-Their-Impacts-on-Sustainable-Development-EN.pdf
- (35) Eswatini Investment Promotion Authority. https://investeswatini.org.sz/why-do-business-in-eswatini/
- (36) The Government of Swaziland. 2016. The Credit Consumer Act https://www.fsra.co.sz/legal/legislation/TheConsumerCreditAct2016.pdf.
- (37) McKinsey. 2018. Mobile Money in Emerging Markets. https://www.mckinsey.com/~/media/mckinsey/industries/financial%20services/our%20insights/mobile%20money%20in%20emerging%20markets%20the%20business%20case%20for%20financial%20inclusion/mobile-money-in-emerging-markets.ashx
- (38) Mukuru International. https://www.mukuru.com/zw/
- (39) UNDP Stakeholder Consultation Interview with Mukuru. January 2022
- (40) GSMA. 2013. Mobile Money: Enabling Regulatory Solutions. https://www.gsma.com/publicpolicy/wp-content/uploads/2013/02/GSMA2013_Report_Mobile-Money-EnablingRegulatorySolutions.pdf
- (41) Kingdom of Swaziland. Financial Sector Development Implementation Plan. March 2017. https://www.fsra.co.sz/media/notices/FinancialSectorDevelopmentImplementationPlan.pdf
- (42) Eswatini Investment Promotion Agency. Eswatini Communications Commission Act of 2013. https://investeswatini.org.sz/swaziland-communications-commission-act/
- (43) United Nations Department of Economic and Social Affairs. Sustainable Development. https://sdgs.un.org/goals/goal10
- (44) Central Bank of Eswatini. Development Finance. https://www.centralbank.org.sz/development-finance/