


Low-Carbon Decentralized Solutions For Waste Treatment
Low-Carbon Decentralized Solutions For Waste Treatment
Business Model Description
Invest in B2B or B2G business models, providing technologies and services to waste management operators, facilities management companies, municipalities, and government agencies for waste treatment and/or sale of renewable energy generated from waste-to-energy systems, and/or sale of valuable by-products generated from the waste treatment process. Such businesses often adopt a 'price per tonne' model, offer a fixed fee for their services, or make directly sell the technology.
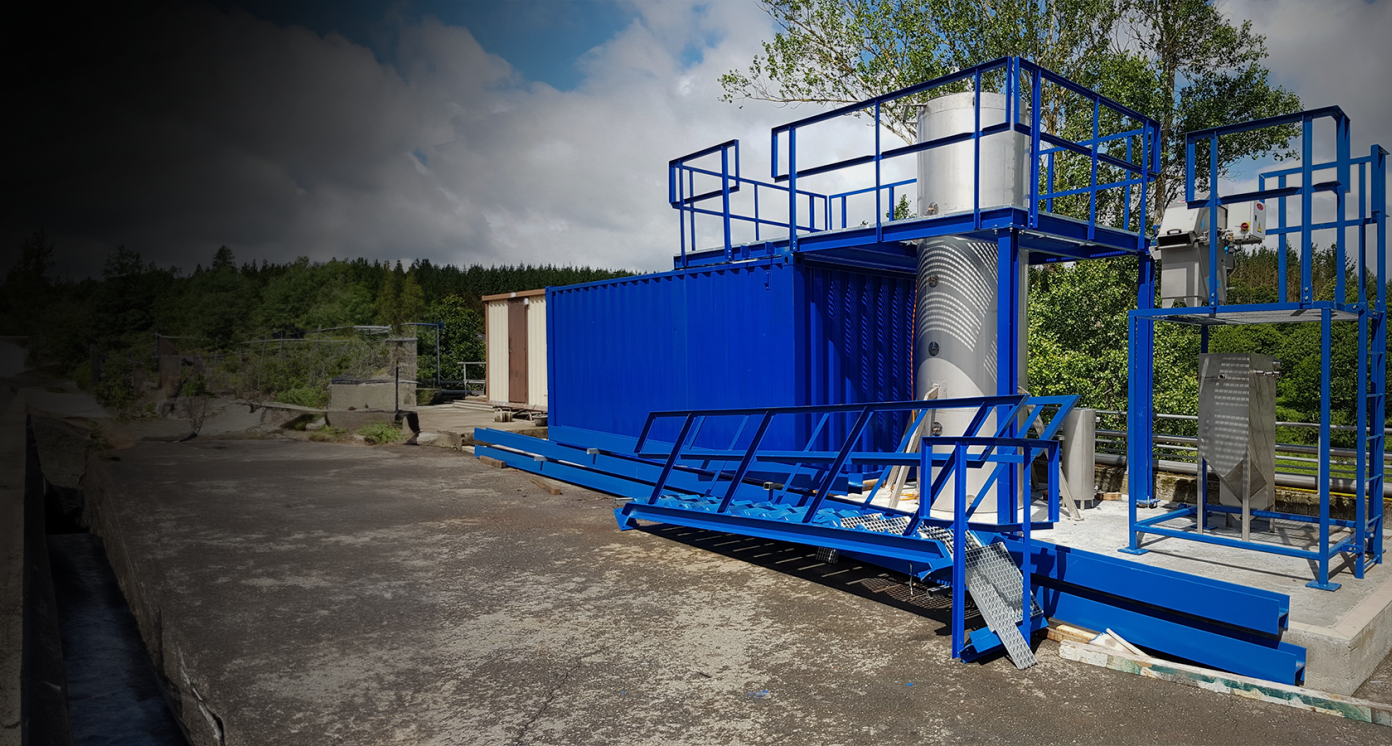
MEC ClearWaste developed a 'plug & play' waste treatment solution, the ClearWaste, that treats solid waste streams. ClearWaste does not use fuel or release harmful emissions, and is mobile and compact, enabling treatment at-source. The ClearWaste has been adopted by large municipalities in Mumbai, Chennai and Dhaka for MSW treatment, and locally with UEM Edgenta for Medical Waste treatment (44).
Green Lagoon Technology Sdn Bhd has developed a series of 'small footprint' modular systems that convert waste and wastewater (including industrial and agricultural wastewater) into biogas. They raised USD 200,000 funding to date as a result of a crowd-funding initiative in 2016, where the subscribers were given the opportunity to take up an equivalent of 6.52 per cent of the Company (45, 47).
Techkem Group offers modular water treatment technologies including the SANDFLOAT, a system with built-in wash-water recovery and sludge removal. A JV with AWC Bhd secured a sub-contract worth USD4.52 million to build a compact water treatment plant in Melaka. The JV generated USD93,225 in revenue in 2021. Subsidiary Techkem Utilities generates an average <USD 5 million in revenue (46, 48).
Expected Impact
Enhance management and recycling of waste, decrease landfill overloading, boost the circular and low-carbon economy, and reduce environmental pollution and public health risks.
How is this information gathered?
Investment opportunities with potential to contribute to sustainable development are based on country-level SDG Investor Maps.
Disclaimer
UNDP, the Private Finance for the SDGs, and their affiliates (collectively “UNDP”) do not seek or solicit investment for programmes, projects, or opportunities described on this site (collectively “Programmes”) or any other Programmes, and nothing on this page should constitute a solicitation for investment. The actors listed on this site are not partners of UNDP, and their inclusion should not be construed as an endorsement or recommendation by UNDP for any relationship or investment.
The descriptions on this page are provided for informational purposes only. Only companies and enterprises that appear under the case study tab have been validated and vetted through UNDP programmes such as the Growth Stage Impact Ventures (GSIV), Business Call to Action (BCtA), or through other UN agencies. Even then, under no circumstances should their appearance on this website be construed as an endorsement for any relationship or investment. UNDP assumes no liability for investment losses directly or indirectly resulting from recommendations made, implied, or inferred by its research. Likewise, UNDP assumes no claim to investment gains directly or indirectly resulting from trading profits, investment management, or advisory fees obtained by following investment recommendations made, implied, or inferred by its research.
Investment involves risk, and all investments should be made with the supervision of a professional investment manager or advisor. The materials on the website are not an offer to sell or a solicitation of an offer to buy any investment, security, or commodity, nor shall any security be offered or sold to any person, in any jurisdiction in which such offer would be unlawful under the securities laws of such jurisdiction.
Country & Regions
- Malaysia: Selangor
- Malaysia: Federal Territory of Kuala Lumpur
- Malaysia: Johor
Sector Classification
Infrastructure
Development need
Infrastructure development is a driver of economic growth and development in Malaysia. Malaysia has over 600 Industrial Estates, with various developments in highways/roads projects (12, 13). Manufacturing, construction as one of the largest share of jobs created (42.7 per cent) accelerating investments in infrastructure remains one of the key development strategies (47).
Policy priority
Major infrastructural improvements since 11th Malaysia Plan have been prioritized such as access to clean water supply, electricity, access to public health centers, broadband infrastructure, paved roads in rural areas, etc. (1) The government has allocated USD 86 billion for developments infrastructure projects (1), in line with the commitment to becoming a net-zero carbon emission country by 2050.
Gender inequalities and marginalization issues
Enhancing Malaysian infrastructure can narrow gender and minority disparities by providing vital services and opportunities (11). It boosts manufacturing and services jobs, bridging rural-urban gaps, empowering marginalized groups (10). Clean water supply mitigates health issues in low-income communities, impacting women and children (47). Women's involvement in waste management at 16 per cent, highlights infrastructure's importance (15). However, unpaid and underpaid labor persists, with health risks impacting 11.3 per cent of the workforce in this sector (15).
Investment opportunities introduction
Malaysia has significant potential for infrastructure investments, particularly in transportation, energy, and SMART implementation. Various incentives are also available for Industrialized Building Systems (4).
Key bottlenecks introduction
East Malaysian states, primarily Sabah and Sarawak, rural infrastructure development persists to remain quite the challenge, particularly due to governance limitation and general connectivity as a result of the lack of integration in rural infrastructure planning process (14, 16).
Waste Management
Development need
Solid waste generation reached 38,427 metric tonnes per day in 2021 (1.17 kg/capita/day) (3). Government allocated 5.2 per cent of development expenditure to waste management in 2022 (2). Only 66 per cent of rural areas have proper waste collection, leading to unsanitary practices and air/water contamination risks (49, 50).
Policy priority
As cities and households are main contributors to municipal solid waste (7), the govt aims to intensify the reduce, reuse and recycle (3R) initiative to help combat through standardizing the process through the National Solid Waste Management Policy 2016 (17). This is in line with the federal government recycling target of 40 per cent by 2025 (1).
Gender inequalities and marginalization issues
In the waste, sewage, and water collection sector, of the 85,500 workforce (46), 16 per cent are full-time female employees. Women constitute 11.3 per cent of unpaid (47), often informal, labor, exposed to health hazards and paid less than male counterparts (15).
Investment opportunities introduction
Currently, waste management relies heavily on the public sector, supported by a regulatory framework (8). Malaysia is developing several SMART city and SMART waste projects, such as SMART Selangor Action Plan (9), encouraging plug and play solutions for waste management, closer to the source of waste generating CO2.
Key bottlenecks introduction
Challenges persist in implementing Sustainable Consumption and Production (SCP). Illegal dumping remains an issue, potentially up to 10 per cent of the total municipal solid waste generated (18). These are compounded by value chain issues, like inefficiencies in collection systems and barriers related to the lack of skills and qualifications in waste management (50).
Waste Management
Pipeline Opportunity
Low-Carbon Decentralized Solutions For Waste Treatment
Invest in B2B or B2G business models, providing technologies and services to waste management operators, facilities management companies, municipalities, and government agencies for waste treatment and/or sale of renewable energy generated from waste-to-energy systems, and/or sale of valuable by-products generated from the waste treatment process. Such businesses often adopt a 'price per tonne' model, offer a fixed fee for their services, or make directly sell the technology.
MEC ClearWaste developed a 'plug & play' waste treatment solution, the ClearWaste, that treats solid waste streams. ClearWaste does not use fuel or release harmful emissions, and is mobile and compact, enabling treatment at-source. The ClearWaste has been adopted by large municipalities in Mumbai, Chennai and Dhaka for MSW treatment, and locally with UEM Edgenta for Medical Waste treatment (44).
Green Lagoon Technology Sdn Bhd has developed a series of 'small footprint' modular systems that convert waste and wastewater (including industrial and agricultural wastewater) into biogas. They raised USD 200,000 funding to date as a result of a crowd-funding initiative in 2016, where the subscribers were given the opportunity to take up an equivalent of 6.52 per cent of the Company (45, 47).
Techkem Group offers modular water treatment technologies including the SANDFLOAT, a system with built-in wash-water recovery and sludge removal. A JV with AWC Bhd secured a sub-contract worth USD4.52 million to build a compact water treatment plant in Melaka. The JV generated USD93,225 in revenue in 2021. Subsidiary Techkem Utilities generates an average <USD 5 million in revenue (46, 48).
Business Case
Market Size and Environment
> USD 1 billion
2021 MSW output was 13.95 million tonnes (20). Waste generation is estimated to be 38,427 metric tonnes per day in 2021 (1.17 kg/capita/day), of which 82.5 per cent is disposed in landfills. By 2022, the amount of MSW collected would be 14 million metric tonnes per annum, 'enough to fill the Petronas Twin Towers every seven days' (43).
Indicative Return
> 25%
Average revenue per unit is estimated to be RM 7 million or USD 1.52 million, based on clinical waste 'price per tonne' supply & operate model. Average revenue per unit based on sale model is estimated to be between USD 500,000 - USD 1,000,000 (21).
One unit refers to one processing machine. Mid-case scenario based on processing 3- 5 tonnes daily and operating 350 days a year. Price assumption at market price, RM 5,000 per tonne (21).
Fast ROI is based on relatively low capital cost of modular and compact waste treatment units (compared to large waste treatment plants).
Investment Timeframe
Short Term (0–5 years)
Stakeholder surveyed in this area noted that it would take 1 -2 years based on revenue generated on a price per tonne basis (21).
Ticket Size
USD 1 million - USD 10 million
Market Risks & Scale Obstacles
Business - Supply Chain Constraints
Capital - Limited Investor Interest
Impact Case
Sustainable Development Need
Growing population increases waste production in Malaysia. In 2021, 32.8 million inhabitants produced an estimated 38,427 metric tonnes per day (1.17 kg of solid waste per capita per day) (3). 82.5 per cent of waste is disposed of in landfills, and as of 2021, the recycling rate reached 31.52 per cent (3, 36).
In 2019, hazardous waste reached 4 million tonnes, of which 516,585 tonnes (12.9 per cent) were recovered locally and abroad (35). In addition, Malaysia faces issues with the illegal disposal of hazardous waste, causing serious problems for community health and the environment (32).
In 2019, medical waste reached 33.8 thousand tonnes and further increased by 17 per cent with the Covid-19 pandemic (35). This type of waste can potentially be dangerous and cause health and environmental risks, which increase with the amount of waste (29).
Gender & Marginalisation
Children are particularly affected by illegal waste disposal, especially of hazardous waste, due to their higher vulnerability to the toxic effects of chemicals. These could cause potential health issues for children in the longer term (32).
Malaysia's waste management and recycling heavily relies on informal and underpaid workers. These workers are exposed to unsafe working environment, which increases their health-related risks (26, 33). Additionally, they remain socially and economically marginalized with below-market wages (41).
In Malaysia, the number of women employed in waste management and water supply is considerably lower than for men (in 2021, 66,400 men compared to 19,100 women, 3.5 times higher) (28). Additionally, women face higher level of health risks than men from exposure and use of plastic (27).
Expected Development Outcome
Decentralized solutions for waste treatment reduce pollution in Malaysia, especially from industrial hazardous waste. The industry is the major producer of this type of waste, with power plants producing 18 per cent of the hazardous waste and the chemical industry 13.7 per cent in 2017 (36, 31, 32, 33).
Low-carbon decentralized waste treatment supports the achievement of the national objective of 40 per cent recycling rate (36) while decreasing GHG emissions, contributing to a net-zero carbon emission economy (30).
On the mid-term, decentralized waste management can enhance circular economy by using waste, including hazardous, as alternative energy sources, such as alternative fuel for energy-intensive industries, reducing landfill and underground storage, and limiting potential pollution issues (31).
Gender & Marginalisation
By decreasing risks of pollution for the environment and public health, decentralized waste treatment facilities, including for hazardous waste, contribute to reducing children's exposure to toxic components (33).
Decentralized solutions for the treatment of waste can decrease the risks waste workers, especially women and informal workers, are exposed to by reducing the amount of hazardous and plastic waste in landfills (27, 33, 41).
With the implementation of a supportive regulatory framework and capacity building programs targeting informal waste workers, especially women, decentralized solutions for waste treatment can contribute to better working conditions and salaries for these segments of the population (41).
Primary SDGs addressed
15.3.1 Proportion of land that is degraded over total land area
15.22 per cent of land in 2019 (34).
12.4.2 (a) Hazardous waste generated per capita; and (b) proportion of hazardous waste treated, by type of treatment
12.5.1 National recycling rate, tons of material recycled
125.6093 kg per capita of hazardous waste in 2019. 98.7 per cent of hazardous waste was treated or disposed of in 2017 (34).
31.52 per cent of waste were recycled in 2021 (36).
By 2025, 40 per cent of household waste and 35 per cent of scheduled waste recycled (35).
11.6.1 Proportion of municipal solid waste collected and managed in controlled facilities out of total municipal waste generated, by cities
38,427 metric tonnes of solid waste generated per day in 2021 (1.17 kg/capita/day) of which around 82.5 per cent disposed in landfills and 30.67 per cent recycled according to 2020 reports (3).
By 2025, 40 per cent of household waste and 35 per cent of scheduled waste recycled (35).
Secondary SDGs addressed
Directly impacted stakeholders
People
Gender inequality and/or marginalization
Planet
Corporates
Public sector
Indirectly impacted stakeholders
People
Planet
Corporates
Public sector
Outcome Risks
If not well coordinated with the currently existing infrastructure and the waste treatment needs, decentralized waste treatment might result in more spread pollution throughout the country.
There is a risk for the decentralized facilities to be too expensive, especially for small manufacturers, industry companies or municipalities, to be broadly adopted.
Gender inequality and/or marginalization risk: Informal waste workers might be affected by tech-based solutions, unless adapted capacity building is provided to ensure their inclusive participation.
Impact Risks
If the price for low-carbon decentralized solutions is too high, stakeholder participation risk might occur especially for small municipalities or small and medium facilities.
The growth in waste volumes may outpace the available small, decentralized solutions and facilities and might have a bearing on impact creation.
Impact Classification
What
Low-carbon decentralized solutions for waste treatment contribute to a cleaner environment and better public health through enhanced waste treatment and decreased landfill storage of waste.
Who
Operators and workers of waste facilities, people living near landfills and general population benefit from improved waste treatment.
Risk
Stakeholder participation risk with potentially high costs. Risks for people and the planet with the uncertain accommodation of growing amount of waste, increasing pollution and health risks.
Contribution
Waste treatment through decentralized solutions contributes to reaching the Government's recycling targets of 40 per cent household waste and 35 per cent of hazardous waste by 2025 (35).
How Much
Integrated Waste Treatment Facilities, such as waste-to-energy, can achieve a reduction of at least 80 to 90 per cent of the quantity of solid waste disposed to landfills (3).
Impact Thesis
Enhance management and recycling of waste, decrease landfill overloading, boost the circular and low-carbon economy, and reduce environmental pollution and public health risks.
Enabling Environment
Policy Environment
Eleventh Malaysian Plan (2016-2020): it advocates for more waste separation and recycling and for waste management facilities' development in rural areas to promote a sustainable living (1). The plan foresees a total average private sector annual investment of RM 291 billion (USD 63.2 billion) (1).
National Urbanization Policy (2016): Aligning with the 11th Malaysian Plan, the policy emphasizes the modernizing of waste management, through the provision safe infrastructure for the disposal and treatment of solid waste and hazardous waste, promoting resource recovery and recycling (24).
National Cleanliness Policy (2020-2030): the policy aims at increasing recycling initiatives among the public to support the waste-to-wealth agenda and contribute to environmental conservation efforts (1).
National Solid Waste Management Policy (2016): the policy aims to standardize and improve waste management approaches in residential, institutional, and commercial areas across the country, particularly in Sabah and Sarawak. The policy calls for the implementation of integrated SWMS (17).
Nationally Determined Contribution (2021): waste is part of Malaysia's climate change action. The sector is mentioned by the report as one of the areas where Malaysia is taking key mitigation actions to reduce GHG emissions and achieve the 45 per cent reduction target (42).
Industry4WRD Policy on Industry 4.0: The policy intends to support companies' digital transformation in manufacturing sector through incentives and support for infrastructure, human capital and technology development (50).
Malaysia Madani: The Malaysia Madani plan has six main principles including Sustainability, with aspirations of conserving the environment and biodiversity. (62)
Financial Environment
Financial incentives: Green Investment Tax Allowance (GITA) for 100 per cent of qualifying capital expenditure incurred on green technology assets for the first three years. It can be offset against 70 per cent of statutory income and unutilized allowances can be carried forward until absorbed (23)
Fiscal incentives: Investment Tax Allowance (ITA) provides allowance of 60 per cent of qualifying capital expenditure incurred within 5 years. It can be offset against 70 per cent of statutory income for each assessment year and the unutilized amount can be carried forward until fully absorbed (49)
Fiscal incentives: Pioneer Status (MIDA) grants a 70 per cent tax exemption on statutory income for a period of 5 years. (49)
Regulatory Environment
Environmental Quality Act 1974: regulates the protection and conservation of the environment, as well as the discharge of waste through the prevention, abatement and control of pollution (37).
Environmental Quality (Prescribed Premises) (Scheduled Waste Treatment and Disposal Facilities) Order 1989: defining the premises where waste cannot be disposed (38).
Solid Waste Management and Public Cleansing 2007: provides for and regulates the management of controlled solid waste and public cleansing for the purpose of maintaining proper sanitation (39).
Environmental Quality (scheduled wastes) Regulations, 2005: provides for the disposal, treatment, management, storage and transport of scheduled wastes, as described by the First Schedule attached to these Regulations (40).
The Solid Waste and Public Cleansing Management Act (Act 672): introduced new regulations to standardize public cleansing management services and classify eight categories of solid waste in Malaysia (39).
Marketplace Participants
Private Sector
MEC ClearWaste; Green Lagoon Technology Sdn Bhd; BioEneco; Techkem Group; UEM Edgenta; Sedafiat Sdn Bhd; Berjaya EnviroParks Sdn Bhd & Berjaya Energies Sdn Bhd; Medivest Sdn Bhd.
Government
Ministry of Natural Resources, Environment and Climate Change (KeTSA); Ministry of Housing and Local Government (KPKT); Ministry of Health (MOF); Ministry of Science Technology and Innovation (MOSTI), SWCorp.
Multilaterals
World Bank; Asian Development Bank (ADB); United Nations Development Programme (UNDP); United Nations Industrial Development Organization (UNIDO); Global Environment Facility (GEF).
Non-Profit
Solid Waste Management Association of Malaysia (SWAM); Malaysian Association of Environmental Health (MAEH); Malaysian Green Technology Corporation (MGTC); Malaysian Association of Waste Management and Recycling (MAWMR).
Public-Private Partnership
Malaysia Digital Economy Corporation (MDEC); Malaysian Technology Development Corporation (MTDC); Malaysia Co-Investment Fund (MyCIF); Malaysian Industry-Government Group for High Technology (MIGHT).
Target Locations

Malaysia: Selangor
Malaysia: Federal Territory of Kuala Lumpur
Malaysia: Johor
References
- (1) Prime Minister’s Department of Economy, Economic Planning Unit. 2021. Twelfth Malaysia Plan (12MP) 2021-2025 : A Prosperous, Inclusive, Sustainable Malaysia. https://rmke12.epu.gov.my/en.
- (2) MOF. 2023. Fiscal Outlook Report: Federal Government Expenditure. https://budget.mof.gov.my/pdf/2022/revenue/section3.pdf.
- (3) MIDA. 2021. Waste to Energy for a Sustainable Future. https://www.mida.gov.my/waste-to-energy-for-a-sustainable-future/.
- (4) MIDA. Incentives for New investment. https://www.mida.gov.my/wp-content/uploads/2020/07/Chapter-2-Incentives-for-New-Investments.pdf.
- (5) Journal of Wastes and Biomass Management. 2019. Study on Waste Generation and Composition in Rapid Residential Development of Sub-urban area of Kuala Selangor District. https://jwbm.com.my/archives/1jwbm2019/1jwbm2019-01-05.pdf.
- (6) Era Suria Entrepreneurs. 2021. Towards a Circular Economy - Waste Management in Malaysia. https://rmke12.epu.gov.my/storage/fileUpload/2021/08/2021082959_dr_s_sri_umeswara.pdf.
- (7) Yatim. 2019. Study on Waste Generation and Composition in Rapid Residential Development of Sub-urban area of Kuala Selangor District https://jwbm.com.my/archives/1jwbm2019/1jwbm2019-01-05.pdf
- (8) Ministry of Energy, Green Technology and Water. 2017. Green Technology Master Plan 2017-2030. https://www.pmo.gov.my/wp-content/uploads/2019/07/Green-Technology-Master-Plan-Malaysia-2017-2030.pdf.
- (9) SSDU. 2020. Selangor SMART Action Plan 2025. https://www.smartselangor.com.my/wp-content/uploads/2020/09/SSAP-OFFICIAL-26Aug20.pdf.
- (10) Asian Development Bank Blog. Making Infrastructure Work for Women and Girls in Asia and the Pacific. https://blogs.adb.org/blog/making-infrastructure-work-women-and-girls-asia-and-pacific.
- (11) DOSM. Malaysia @ a Glance. https://www.dosm.gov.my/v1/index.php?r=column/cone&menu_id=dDM2enNvM09oTGtQemZPVzRTWENmZz09.
- (12) Abu Bakar, N. and Abdullah, N. 2007. Labour Force Participation in Malaysia, Bakar, LABOR FORCE PARTICIPATION OF WOMEN IN MALAYSIA. http://repo.uum.edu.my/id/eprint/2469/1/Nor%E2%80%99Aznin_Abu_Bakar.pdf.
- (13) MOF. 2023. Budget 2023. https://budget.mof.gov.my/manfaat/.
- (14) Edward Tuah, M. A., Tedong, P. A., & Md. Dali, M. 2022. THE CHALLENGES IN RURAL INFRASTRUCTURE PLANNING GOVERNANCE IN SARAWAK. PLANNING MALAYSIA. https://doi.org/10.21837/pm.v20i24.1214.
- (15) UNDP. 2021. Issue Brief: Advancing Gender Equality in Malaysia https://malaysia.un.org/en/123021-issue-brief-advancing-gender-equality-malaysia
- (16) Ngah, I. 2009. Rural Development in Malaysia. https://www.academia.edu/400316/Rural_Development_in_Malaysia
- (17) Prime Minister Office. 2016. National Solid Waste Management Policy. https://www.pmo.gov.my/2019/07/national-solid-waste-management-policy/.
- (18) Pariatamby, A. & Bhatti, M. S. 2020. Waste Management Challenges in Malaysia. https://doi.org/10.4018/978-1-7998-0198-6.ch008.
- (19) Department of Statistics Malaysia. 2023. Annual Economic Statistics 2022 Water Supply; Sewerage, Waste Management & Remediation Activities. https://www.dosm.gov.my/v1/index.php/index.php?r=column/cthemeByCat&cat=469&bul_id=RVAxVkxqUVI5WGJSRHdWM1N3Rjk3dz09&menu_id=NWVEZGhEVlNMeitaMHNzK2htRU05dz09.
- (20) MIDA. 2023. The Preffered Approach for Waste Management in Malaysia. https://www.mida.gov.my/waste-to-energy-wte-the-preferred-approach-for-waste-management-in-malaysia/.
- (43) MIDA. 2021. Waste to Energy for a Sustainable Future. https://www.mida.gov.my/waste-to-energy-for-a-sustainable-future/.
- (21) Stakeholder Consultation on April 3, 2023
- (22) MIDA. Sustainable Waste Management: challenges and opportunities. https://www.mida.gov.my/sustainable-waste-management-in-malaysia-opportunities-and-challenges/.
- (23) MGTC. 2022. Green Investment Tax Allowance (GITA) & Green Income Tax Exemption (GITE). https://www.mgtc.gov.my/what-we-do/green-incentives/green-investment-tax-incentives-gita-gite/.
- (24) Prime Minister's Office. 2016. National Urbanization Policy. https://www.pmo.gov.my/2019/07/national-urbanization-policy-2/.
- (25) Department of Statistics Malaysia. 2023. Annual Economic Statistics Subsector Water Supply, Sewerage, Waste Management and Remediation Activities. https://www.dosm.gov.my/portal-main/release-content/3f64779d-8ba9-11ed-96a6-1866daa77ef9#:~:text=3%20billion%20(2020%3A%20RM9.
- (26) Ministry of Foreign Affairs of the Netherlands. 2021. Circular Economy Opportunities in Malaysia. https://www.rvo.nl/sites/default/files/2022/03/Malaysia%20Booster%20Programme.pdf.
- (27) Heinrich Boll Stifung, Southeast Asia. 2022. The plastic Crisis Must Be on the Feminist Agenda. https://th.boell.org/en/2022/03/18/plastic-crisis-must-be-feminist-agenda.
- (28) Ministry of Women, Family and Community Development. 2021. Statistics on Women, Family and Community. https://www.kpwkm.gov.my/kpwkm/uploads/files/Penerbitan/Buku%20Perangkaan/e-book%E2%80%A2KPWKM%202020-2021%20291122.pdf.r=column/cthemeByCat&cat=509&bul_id=ZFRzTG9ubTkveFR4YUY2OXdNNk1GZz09&menu_id=L0pheU43NWJwRWVSZklWdzQ4TlhUUT09.
- (29) WHO. 2018. Health-care waste. https://www.who.int/news-room/fact-sheets/detail/health-care-waste#:~:text=Health%20risks,health%20facilities%20into%20the%20environment.
- (30) WOIMA. Decentralized Waste Management and Power Generation. https://woimacorporation.com/decentralized-waste-to-value/#:~:text=Decentralized%20waste%20management%20and%20power%20generation&text=Decentralizing%20the%20waste%2Dto%2Dvalue,due%20to%20shorter%20transportation%20distances.
- (31) Y.H. Chin and H.N.A. Yong. 2019. Barriers and critical success factors towards sustainable hazardous waste management in electronic industries – A review. https://iopscience.iop.org/article/10.1088/1757-899X/669/1/012029/pdf.
- (32) Mohd Faiz Ibrahim, et al. 2021. The Impacts of Illegal Toxic Waste Dumping on Children’s Health: A Review and Case Study from Pasir Gudang, Malaysia. https://www.mdpi.com/1660-4601/18/5/2221.
- (33) Nor Faiza M.T., Noor Artika H. and Yusof M.Z.. 2019. Health Care Waste Management and Sustainable Development Goals in Malaysia. https://jwbm.com.my/archives/1jwbm2019/1jwbm2019-18-20.pdf.
- (34) UN Department of Economic and Social Affairs. 2022. SDG Indicators Database. https://unstats.un.org/sdgs/dataportal/database.
- (35) Economic Planning Unit (EPU). 2021. Malaysia Voluntary National Review (VNR) 2021. https://www.epu.gov.my/sites/default/files/2021-07/Malaysia_Voluntary_National_Review_%28VNR%29_2021.pdf.
- (36) MIDA. 2023. The Preffered Approach for Waste Management in Malaysia. https://www.mida.gov.my/waste-to-energy-wte-the-preferred-approach-for-waste-management-in-malaysia/.
- (37) Government of Malaysia. 1974. Law of Malaysia, Act 127, Environment Quality Act 1974. https://www.env.go.jp/en/recycle/asian_net/Country_Information/Law_N_Regulation/Malaysia/Malaysia_mal13278.pdf.
- (38) Federal Subsidiary Legislation. 1974. Environment Quality Act 1074, P.U.(A). 140/89, Environmental Quality (Prescribed Premises) (Scheduled Waste Treatment and Disposal Facilities) Order 1989. https://ewaste.doe.gov.my/wp-content/uploads/2020/12/Environmental-Quality-Prescribed-Premises-Scheduled-Wastes-Treatment-And-Disposal-Facilities-Order-1989-P.U.A-140-89.pdf.
- (39) Government of Malaysia. 2007. Law of Malaysia, Act 672, Solid Waste Management and Public Cleansing 2007. http://rehdainstitute.com/wp-content/uploads/2016/05/Solid-Waste-and-Public-Cleansing-Management-Act-2007.pdf.
- (40) Minister of Natural Resources and the Environment. 2005. Environment Quality Act 1974, Environment Quality Schedule Waste Regulations 2005, Arrangement of Regulation. https://www.env.go.jp/en/recycle/asian_net/Country_Information/Law_N_Regulation/Malaysia/Malaysia%20EQA%20Scheduled%20Waste%202005.pdf.
- (41) New Straits Times. 2022. New sustainability commitments an opportunity to uplift Malaysia's informal sector. https://www.nst.com.my/opinion/columnists/2022/11/849477/new-sustainability-commitments-opportunity-uplift-malaysias.
- (42) Government of Malaysia. 2022. Malaysia's Update of its Nationally Determined Contribution. https://unfccc.int/sites/default/files/NDC/2022-06/Malaysia%20NDC%20Updated%20Submission%20to%20UNFCCC%20July%202021%20final.pdf.
- (44) MEC ClearWaste. 2023. Stakeholder Consultations. https://mec-clearwaste.com/
- (45) Green Lagoon Technologies. 2023. Investor Relations. https://glt.my/investor-relations/
- (46) Techkem Group. 2021. Annual Report. https://techkem.com.my/; file:///C:/Users/user/Downloads/AWC%20AR%202021.pdf ;
- (47) Crunchbase. 2023. Green Lagoon Technologies. https://www.crunchbase.com/organization/green-lagoon/company_financials
- (48) Zoominfo. 2023. Techkem Utilities Sdn Bhd. https://www.zoominfo.com/c/techkem-utilities-sdn/547245003
- (49) MIDA. 2020. Incentives for New Investment. https://www.mida.gov.my/wp-content/uploads/2020/07/Chapter-2-Incentives-for-New-Investments.pdf
- (50) Government of Malaysia. Industry 4WRD Policy. 2018. https://www.miti.gov.my/index.php/pages/view/4832
- (51) Government of Malaysia. Economic & Fiscal Outlook and Federal Government Revenue Estimates 2023. 2023. https://budget.mof.gov.my/pdf/belanjawan2023/ekonomi-fiskal/EUFORE2023_270223.pdf