


Integration Of Smart Technologies In Transfer Stations And Material Recovery Facilities
Integration Of Smart Technologies In Transfer Stations And Material Recovery Facilities
Business Model Description
Invest in B2B models that sell and lease smart technology solutions directly to Transfer Stations and MRF (Material Recovery Facility) operators. Additionally, B2G models sell and lease solutions to government entities that oversee waste management. Revenue is generated through these sales, leasing of equipment, as well as maintenance contracts and support services. They may also offer subscription-based services for data analytics tools. Examples of companies active in this space are:
Arachem is an engineering company that produces a range of equipment including smart technologies for waste management. These include fluid mixers, waste sorters, weighing systems, grinders, dryers and ancillary equipment such as filters and pumps. Arachem's estimated revenue is between USD 25 million - USD 100 million per annum (54).
Tomra is a Norwegien MNC with a branch in Malaysia. Tomra offers advanced sensor-based sorting systems under the range 'AUTOSORT' which facilitates effective waste recovery. Their Tomra Insights platform enables data-driven optimization of sorting processes through online monitoring. Tomra is a publicly listed company and generated total revenues of about USD 1.27 billion in 2022 (52).
Eriez is an American MNC with a branch in Johor, Malaysia. Eriez designs and engineers' magnetic separation technologies with advanced metal detection systems. They also offer vibrating conveyors, feeding systems and automated sorting technologies. In 2022, Eriez generated a total revenue of USD 190 million (53).
Expected Impact
Enhance the efficiency of waste sorting, treatment and recycling, decrease pollution, enhance circular economy, and increase environmental and community health.
How is this information gathered?
Investment opportunities with potential to contribute to sustainable development are based on country-level SDG Investor Maps.
Disclaimer
UNDP, the Private Finance for the SDGs, and their affiliates (collectively “UNDP”) do not seek or solicit investment for programmes, projects, or opportunities described on this site (collectively “Programmes”) or any other Programmes, and nothing on this page should constitute a solicitation for investment. The actors listed on this site are not partners of UNDP, and their inclusion should not be construed as an endorsement or recommendation by UNDP for any relationship or investment.
The descriptions on this page are provided for informational purposes only. Only companies and enterprises that appear under the case study tab have been validated and vetted through UNDP programmes such as the Growth Stage Impact Ventures (GSIV), Business Call to Action (BCtA), or through other UN agencies. Even then, under no circumstances should their appearance on this website be construed as an endorsement for any relationship or investment. UNDP assumes no liability for investment losses directly or indirectly resulting from recommendations made, implied, or inferred by its research. Likewise, UNDP assumes no claim to investment gains directly or indirectly resulting from trading profits, investment management, or advisory fees obtained by following investment recommendations made, implied, or inferred by its research.
Investment involves risk, and all investments should be made with the supervision of a professional investment manager or advisor. The materials on the website are not an offer to sell or a solicitation of an offer to buy any investment, security, or commodity, nor shall any security be offered or sold to any person, in any jurisdiction in which such offer would be unlawful under the securities laws of such jurisdiction.
Country & Regions
- Malaysia: Selangor
- Malaysia: Federal Territory of Kuala Lumpur
- Malaysia: Countrywide
Sector Classification
Infrastructure
Development need
Infrastructure development is a pivotal driver of economic growth and development in Malaysia. Malaysia has over 600 Industrial Estates, with various developments in highways/roads projects (12, 13). With manufacturing, construction as one of the largest share of jobs created (42.7 per cent) accelerating investments in infrastructure remains one of the key development strategies (47).
Policy priority
Major infrastructural improvements since 11th Malaysia Plan. for e.g., access to clean water supply, electricity, access to public health centers, broadband infrastructure, paved roads in rural areas, etc (1). The government has allocated ~USD 86billion for developments infrastructure projects (1), in line with the commitment to becoming a net-zero carbon emission country by 2050.
Gender inequalities and marginalization issues
Enhancing Malaysian infrastructure can narrow gender and minority disparities by providing vital services and opportunities (11). It boosts manufacturing and services jobs, bridging rural-urban gaps, empowering marginalized groups (10). Women's labor force participation rises, particularly in these sectors (11). Clean water supply mitigates health issues in low-income communities, impacting women and children (47). Women's waste management involvement (16 per cent) highlights infrastructure's importance (15). However, unpaid and underpaid labor persists, with health risks (11.3 per cent) (15).
Investment opportunities introduction
Malaysia has significant potential for infrastructure investments, particularly in transportation, energy, and SMART implementation. Income tax exemptions and investment tax allowances are also available for Industrialized Building Systems (4).
Key bottlenecks introduction
In east Malaysian states, primarily Sabah and Sarawak, rural infrastructure development persists as a challenge, particularly due to governance limitations and general connectivity issues resulting from a lack of integration in rural infrastructure planning process (14, 16).
Waste Management
Development need
Solid waste generation reached 38,427 metric tonnes per day in 2021 (1.17 kg/capita/day) (3). Government allocated 5.2 per cent of development expenditure to waste management in 2022 (2). Only 66 per cent of rural areas have proper waste collection, leading to unsanitary practices and air/water contamination risks (49, 50).
Policy priority
As cities and households are main contributors to municipal solid waste (7), the govt aims to intensify the reduce, reuse and recycle (3R) initiative to help combat through standardizing the process through the National Solid Waste Management Policy 2016 (17). This is in line with the federal government recycling target of 40 per cent by 2025 (1).
Gender inequalities and marginalization issues
In the waste, sewage, and water collection sector, of the 85,500 workforce (46), 16 per cent are full-time female employees. Women constitute 11.3 per cent of unpaid (47), often informal, labor, exposed to health hazards and paid less than male counterparts (15).
Investment opportunities introduction
Currently, waste management relies heavily on the public sector, supported by a regulatory framework (8). Additionally, Malaysia is developing several SMART city and SMART waste projects, such as SMART Selangor Action Plan (9) that require investment in technology infrastructure, including sensors, data centers, and communication networks.
Key bottlenecks introduction
Challenges persist in implementing Sustainable Consumption and Production (SCP). Illegal dumping remains an issue, potentially up to 10 per cent of the total municipal solid waste generated (18). These are compounded by value chain issues, like inefficiencies in collection systems and barriers related to the lack of skills and qualifications in waste management (50).
Waste Management
Pipeline Opportunity
Integration Of Smart Technologies In Transfer Stations And Material Recovery Facilities
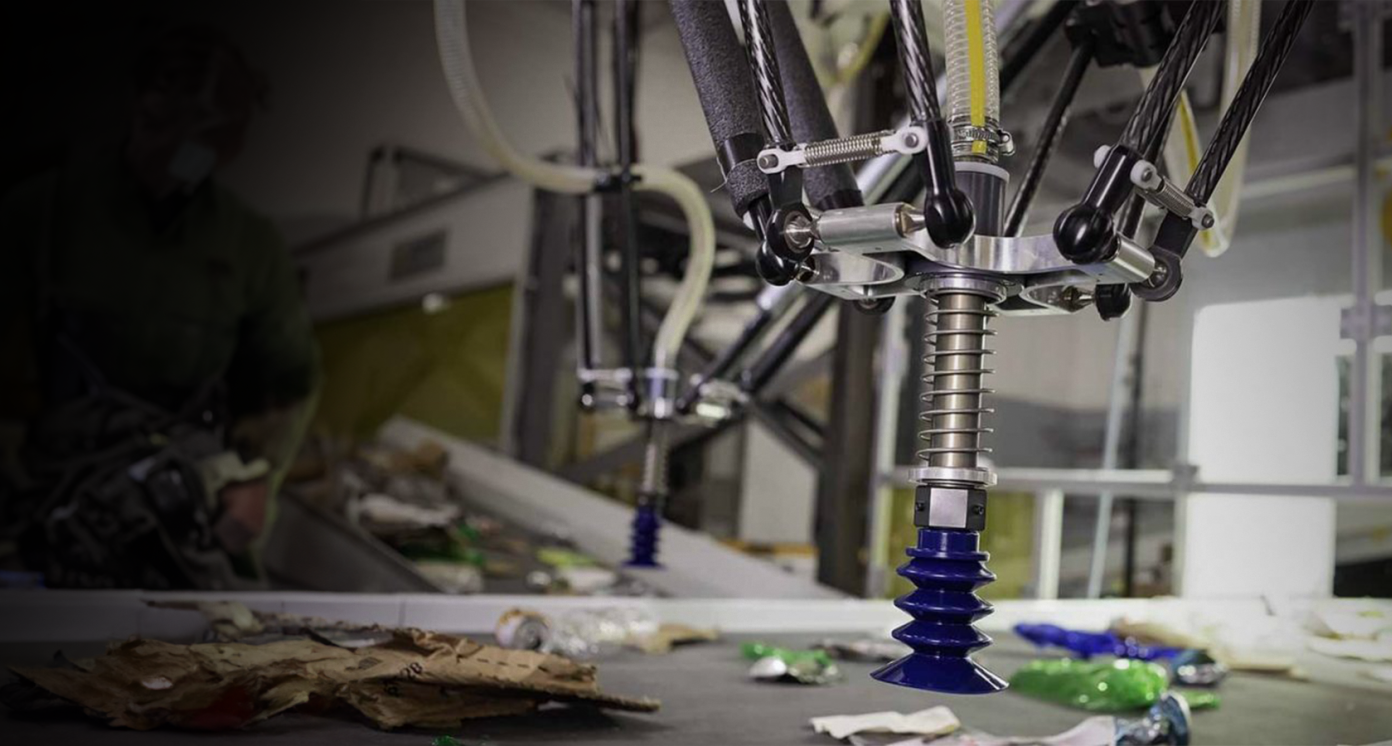
Invest in B2B models that sell and lease smart technology solutions directly to Transfer Stations and MRF (Material Recovery Facility) operators. Additionally, B2G models sell and lease solutions to government entities that oversee waste management. Revenue is generated through these sales, leasing of equipment, as well as maintenance contracts and support services. They may also offer subscription-based services for data analytics tools. Examples of companies active in this space are:
Arachem is an engineering company that produces a range of equipment including smart technologies for waste management. These include fluid mixers, waste sorters, weighing systems, grinders, dryers and ancillary equipment such as filters and pumps. Arachem's estimated revenue is between USD 25 million - USD 100 million per annum (54).
Tomra is a Norwegien MNC with a branch in Malaysia. Tomra offers advanced sensor-based sorting systems under the range 'AUTOSORT' which facilitates effective waste recovery. Their Tomra Insights platform enables data-driven optimization of sorting processes through online monitoring. Tomra is a publicly listed company and generated total revenues of about USD 1.27 billion in 2022 (52).
Eriez is an American MNC with a branch in Johor, Malaysia. Eriez designs and engineers' magnetic separation technologies with advanced metal detection systems. They also offer vibrating conveyors, feeding systems and automated sorting technologies. In 2022, Eriez generated a total revenue of USD 190 million (53).
Business Case
Market Size and Environment
> USD 1 billion
2021 Solid Municipal Waste output was 13.95 million tonnes. 13.91 million tonnes in 2020 and 13.88 million tonnes in 2019 (19).
165 landfills, eight sanitary landfills, and three inert landfills (42). 753 licensed scheduled waste facilities and transporters as of May 2023 (43).
2021 Solid Municipal Waste output was 13.95 million tonnes. 13.91 million tonnes in 2020 and 13.88 million tonnes in 2019 (19).
Malaysia's solid municipal output is increasing. In 2021, it stood at 13.95 million tonnes, whereas in 2019 it was 13.88 million tonnes. Waste collection facilities are fragmented, with the state taking on a Public Private Partnership (PPP) role with waste collectors. Waste is collected and then sent to transfer stations/ MRFs for treatment and recovery. Remaining waste is then landfilled.
Indicative Return
< 5%
Expert stakeholder consultations have revealed that ROI in this space would be very low at this juncture. Startup costs, compounded by the required runway to activate the business model are significant upfront costs, and in the medium term, any profits would be directed to addressing these costs.
Investment Timeframe
Medium Term (5–10 years)
A medium-term timeframe is appropriate amid the high startup costs and upfront costs needed. Any profits derived from such activities will be used to address these costs in the medium term before the possibility of profitability comes into question (21).
Ticket Size
USD 1 million - USD 10 million
Market Risks & Scale Obstacles
Capital - Limited Investor Interest
Capital - CapEx Intensive
Impact Case
Sustainable Development Need
Every year, Malaysia loses around RM 476 million (USD 104.16 million) in recyclable resources due to inadequate recycling (31). Illegal dumping also incurs high costs. According to 2018 reports, Kuala Lumpur alone spends around RM 200,000 - USD 43,76 per month to clear illegal dumping sites (1).
Increasing population, urbanization and living standards intensify the amount of waste generated and increase the burden on the current waste management system. In 2021, Malaysia produced 3,039,200 metric tons of solid waste, representing 1.17 kg of waste per capita per day (1, 3, 6, 41).
Landfills are saturated and often located in unsuitable sites, causing serious health and environmental problems. These are particularly caused by the emission of greenhouse and other toxic gases during treatment and disposal procedures (37).
Gender & Marginalisation
There are less waste management facilities in rural than in urban areas, especially in Sabah and Sarawak. Additionally, the supply of basic services, including waste management, is insufficient in these regions (1, 34).
Malaysia's waste management relies on informal workers (32), who are often victims of human rights abuses, economic and social marginalization, including because of below-market wages (33). Informal workers also tend to work in unsafe conditions, increasing their health-related risks (37).
In Malaysia, the number of women employed in waste management and water supply is considerably lower than the number of men (in 2021, 66,400 men compared to 19,100 women, 3.5 times higher) (30). Additionally, women face higher level of health risks caused by exposure and use of plastic than men (26).
Expected Development Outcome
Smart waste management and recycling contribute to Malaysia's green urban development by boosting the Reduce, Reuse and Recycle (3R) initiative. Malaysia's objective is to reach about 95 per cent waste treatment and only 5 per cent of waste to be disposed in sanitary landfills (1).
Technology adoption in the waste management chain will enhance waste segregation and recycling, boosting the circular economy in Malaysia, particularly by introducing more waste-to-wealth practices, supporting local communities' prosperity (1).
Gender & Marginalisation
Increased waste management facilities in rural areas, including in Sabah and Sarawak, will reduce the urban-rural development gap and gap in access to basic infrastructure and services (1, 28, 29).
Better waste management and recycling create momentum for more socially responsible practices, benefiting informal waste workers, who collected 99.9 per cent of the recycled plastic in 2019 (33, 25). Adoption of technologies in transfer stations contribute to decreasing their exposure to health risks (37).
If a conductive environment is adopted, enhanced waste management and recycling can contribute to challenging traditional gender types at work and give way to more women inclusion (40). It can also contribute to reduce women's exposure to toxic waste, decreasing their health-risks (26, 37).
Primary SDGs addressed
11.6.1 Proportion of municipal solid waste collected and managed in controlled facilities out of total municipal waste generated, by cities
38,427 metric tonnes of solid waste generated per day in 2021 (1.17 kg/capita/day) of which around 82.5 per cent disposed in landfills and 30.67 per cent recycled according to 2020 reports (3).
The objective is to reach 40 per cent of recycling for household waste and 35 per cent for scheduled waste by 2025 (1).
12.4.2 (a) Hazardous waste generated per capita; and (b) proportion of hazardous waste treated, by type of treatment
12.5.1 National recycling rate, tons of material recycled
125.6093 kg per capita of hazardous waste in 2019. 98.7 per cent of hazardous waste was treated or disposed of in 2017 (35).
31.52 per cent of waste were recycled in 2021 (27).
The objective is to reach 40 per cent of recycling for household waste and 35 per cent for scheduled waste by 2025 (1).
15.3.1 Proportion of land that is degraded over total land area
15.22 per cent of land in 2019 (35).
Secondary SDGs addressed
Directly impacted stakeholders
People
Gender inequality and/or marginalization
Planet
Corporates
Public sector
Indirectly impacted stakeholders
People
Gender inequality and/or marginalization
Planet
Corporates
Public sector
Outcome Risks
The integration of technology in the waste management chain might increase energy consumption and the GHG emissions status quo will remain unchanged unless the waste-tech systems are powered by renewables.
Technological enhancement of waste transfer and material recovery facilities might create job losses due to automation, negatively impacting already marginalized waste workers.
Gender inequality and/or marginalization risk: Only the formal waste management sector might consider adopting technologies in its operations, the informal sector remaining unchanged and exposed to toxic waste.
Impact Risks
Lack of capacity building to upskill the workforce may reinforce the marginalization of waste workers, including the informal ones, leading to a compromised impact.
Lack of information on the current waste flows, segregation, and recycling might decrease the effectiveness of smart waste treatment, constituting a risk for impact creation (32).
The high costs of technology adoption and the lack of necessary high-tech expertise might limit stakeholder participation (38).
Impact Classification
What
Integration of technology in waste transfer and material recovery facilities decreases pollution, improves sustainable urbanization and enhances recycling through more efficient practices.
Who
People working in the waste management sector, including informal workers and women, operators of Transfer Stations Facilities and technology suppliers.
Risk
Potential technological errors, lack of necessary info on the current waste management system, high costs of technology adoption and lack of expertise constitute risks for impact.
Contribution
Investments in the IOA can potentially contribute to bringing down waste related GHG emissions that accounted for 8.5 per cent of total GHG emissions in 2019 (36).
How Much
Malaysia loses every year an estimated RM 476 million (USD 103.7 million) in recyclable resources (31).
Impact Thesis
Enhance the efficiency of waste sorting, treatment and recycling, decrease pollution, enhance circular economy, and increase environmental and community health.
Enabling Environment
Policy Environment
Twelfth Malaysia Plan (2021-2025): it highlights the efficient and performant waste treatment's contribution to circular economy, greener and resilient communities. It emphasizes the private sector's role thereof, targeting private investments of RM 290,268 million (USD 63,219 million) by 2025 (1).
National Cleanliness Policy (2020-2030): the policy aims at increasing recycling initiatives among the public to support the waste-to-wealth agenda and contribute to environmental conservation efforts (1).
National Solid Waste Management Policy (2016): the policy aims to standardize and improve waste management approaches in residential, institutional, and commercial areas across the country, particularly in Sabah and Sarawak. The policy calls for the implementation of integrated SWMS. (17)
Nationally Determined Contribution (2021): waste is part of Malaysia's climate change action. The sector is mentioned by the report as one of the areas where Malaysia is taking key mitigation actions to reduce GHG emissions and achieve the 45 per cent reduction target (45).
Industry4WRD Policy on Industry 4.0: The policy intends to support companies' digital transformation in manufacturing sector through incentives and support for infrastructure, human capital and technology development (55).
Malaysia Madani: The Malaysia Madani plan has six main principles including Sustainability, with aspirations of conserving the environment and biodiversity (56)
Financial Environment
Fiscal incentives: Investment Tax Allowance (ITA) provides allowance of 60 per cent of qualifying capital expenditure incurred within 5 years. It can be offset against 70 per cent of statutory income for each assessment year and the unutilized amount can be carried forward until fully absorbed (4)
Fiscal incentives: Pioneer Status (MIDA) grants a 70 per cent tax exemption on statutory income for a period of 5 years. (4)
Financial incentives: Green Investment Tax Allowance (GITA) for 100 per cent of qualifying capital expenditure incurred on green technology assets for the first three years. It can be offset against 70 per cent of statutory income and unutilized allowances can be carried forward until absorbed. (23)
Regulatory Environment
Solid Waste and Public Cleansing Management (Scheme for Commercial, Industrial and Institutional Solid Waste) Regulations 2018: aims at ensuring the separation at source of commercial, industrial and institutional waste, thereby enabling proper treatment and disposal (1).
Cleansing Management Act: regulates standardization of public cleansing management services and categorize 8 solid wastes in Malaysia (32).
Environmental Quality Act 1974: regulates the protection and conservation of the environment, as well as the discharge of waste through the prevention, abatement and control of pollution (39).
Solid Waste and Public Cleansing Management Act (Act 672): provides the framework for managing and regulating SWM & public cleansing activities, emphasizing the 3R's. The Act also provides clear definitions of solid waste, and licensing regulations for these facilities. (24)
Solid Waste and Public Cleansing Management Act (Act 672): introduced new regulations to standardize public cleansing management services and classify eight categories of solid waste in Malaysia (24).
Marketplace Participants
Private Sector
Arachem; Tomra' Eriez; Beston' Greenviro Sdn Bhd; MM Century; SK Ecoplant; Alam Flora; Cenviro Sdn Bhd; Khazanah Nasional Berhad.
Government
Ministry of Natural Resources, Environment and Climate Change (KeTSA); Ministry of Local Government Development; Ministry of Science Technology and Innovation (MOSTI).
Multilaterals
World Bank; Asian Development Bank (ADB); United Nations Development Programme (UNDP); United Nations Industrial Development Organization (UNIDO); Global Environment Facility (GEF).
Non-Profit
Solid Waste Management Association of Malaysia (SWAM); Malaysian Association of Environmental Health (MAEH); Malaysian Green Technology Corporation (MGTC); Malaysian Association of Waste Management and Recycling (MAWMR).
Public-Private Partnership
Malaysia Digital Economy Corporation (MDEC); Malaysian Technology Development Corporation (MTDC); Malaysia Co-Investment Fund (MyCIF); Malaysian Industry-Government Group for High Technology (MIGHT).
Target Locations

Malaysia: Selangor
Malaysia: Federal Territory of Kuala Lumpur
Malaysia: Countrywide
References
- (1) Prime Minister’s Department of Economy, Economic Planning Unit. 2021. Twelfth Malaysia Plan (12MP) 2021-2025 : A Prosperous, Inclusive, Sustainable Malaysia. https://rmke12.epu.gov.my/en.
- (2) MOF. 2023. Fiscal Outlook Report: Federal Government Expenditure. https://budget.mof.gov.my/pdf/2022/revenue/section3.pdf.
- (3) MIDA. 2021. Waste to Energy for a Sustainable Future. https://www.mida.gov.my/waste-to-energy-for-a-sustainable-future/.
- (4) MIDA. Incentives for New investment. https://www.mida.gov.my/wp-content/uploads/2020/07/Chapter-2-Incentives-for-New-Investments.pdf.
- (5) Journal of Wastes and Biomass Management. 2019. Study on Waste Generation and Composition in Rapid Residential Development of Sub-urban area of Kuala Selangor District. https://jwbm.com.my/archives/1jwbm2019/1jwbm2019-01-05.pdf.
- (6) Era Suria Entrepreneurs. 2021. Towards a Circular Economy - Waste Management in Malaysia. https://rmke12.epu.gov.my/storage/fileUpload/2021/08/2021082959_dr_s_sri_umeswara.pdf.
- (7) Journal of Wastes and Biomass Management. 2019. Study on Waste Generation and Composition in Rapid Residential Development of Sub-urban area of Kuala Selangor District. https://jwbm.com.my/archives/1jwbm2019/1jwbm2019-01-05.pdf.
- (8) Ministry of Energy, Green Technology and Water. 2017. Green Technology Master Plan 2017-2030. https://www.pmo.gov.my/wp-content/uploads/2019/07/Green-Technology-Master-Plan-Malaysia-2017-2030.pdf.
- (9) Selangor SMART Action Plan 2025 https://www.smartselangor.com.my/wp-content/uploads/2020/09/SSAP-OFFICIAL-26Aug20.pdf
- (10) Asian Development Bank Blog. Making Infrastructure Work for Women and Girls in Asia and the Pacific. https://blogs.adb.org/blog/making-infrastructure-work-women-and-girls-asia-and-pacific.
- (11) DOSM. Malaysia @ a Glance. https://www.dosm.gov.my/v1/index.php?r=column/cone&menu_id=dDM2enNvM09oTGtQemZPVzRTWENmZz09.2
- (12) Abu Bakar, N. and Abdullah, N. 2007. Labour Force Participation in Malaysia. LABOR FORCE PARTICIPATION OF WOMEN IN MALAYSIA http://repo.uum.edu.my/id/eprint/2469/1/Nor%E2%80%99Aznin_Abu_Bakar.pdf.
- (13) MOF. 2023. Budget 2023. https://budget.mof.gov.my/manfaat/.
- (14) Tuah et al. 2022. The challenges in rural infrastructure planning governance in Sarawak. https://www.planningmalaysia.org/index.php/pmj/article/view/1214
- (15) UNDP. 2021. Issue Brief: Advancing Gender Equality in Malaysia https://malaysia.un.org/en/123021-issue-brief-advancing-gender-equality-malaysia
- (16) Ngah. 2009. Rural Development in Malaysia. https://www.academia.edu/400316/Rural_Development_in_Malaysia
- (17) Ministry of Housing and Local Government. 2016. National Solid Waste Management Policy. https://www.pmo.gov.my/2019/07/national-solid-waste-management-policy/.
- (18) Pariatamby, A. & Bhatti, M. S. 2020. Waste Management Challenges in Malaysia. https://doi.org/10.4018/978-1-7998-0198-6.ch008.
- (19) Malaysia Investment Development Authority. 2022. The Preferred Approach for Waste Management in Malaysia https://www.mida.gov.my/waste-to-energy-wte-the-preferred-approach-for-waste-management-in-malaysia/.
- (20) DOSM. 2023. Annual Economic Statistics Subsector Water Supply, Sewerage, Waste Management and Remediation Activities. https://www.dosm.gov.my/portal-main/release-content/3f64779d-8ba9-11ed-96a6-1866daa77ef9#:~:text=3%20billion%20(2020%3A%20RM9.
- (21) Stakeholder consultation on April 5, 2023.
- (22) MIDA. Sustainable Waste Management: challenges and opportunities. https://www.mida.gov.my/sustainable-waste-management-in-malaysia-opportunities-and-challenges/.
- (23) MGTC,2022. Guideline for Green Technology Tax Incentive (GITA/GITE) https://www.myhijau.my/wp-content/uploads/2022/05/REC-GTGT-007-GUIDELINES-FOR-GREEN-TECHNOLOGY-TAX-INCENTIVE-GITAGITE.pdf
- (24) Government of Malaysia. 2007. Law of Malaysia, Act 672, Solid Waste Management and Public Cleansing 2007. http://rehdainstitute.com/wp-content/uploads/2016/05/Solid-Waste-and-Public-Cleansing-Management-Act-2007.pdf.
- (25) World Bank. 2021. Market Study for Malaysia: Plastics Circularity Opportunities and Barriers. https://www.worldbank.org/en/country/malaysia/publication/market-study-for-malaysia-plastics-circularity-opportunities-and-barriers.
- (26) Heinrich Boll Stifung, Southeast Asia. 2022. The plastic Crisis Must Be on the Feminist Agenda. https://th.boell.org/en/2022/03/18/plastic-crisis-must-be-feminist-agenda.
- (27) MIDA. The Preferred Approach for Waste Management in Malaysia. https://www.mida.gov.my/waste-to-energy-wte-the-preferred-approach-for-waste-management-in-malaysia/.
- (28) Constantin. 2017. Solid Waste Management in Rural Areas. https://www.researchgate.net/publication/319668416_Solid_Waste_Management_in_Rural_Areas
- (29) Vinti, Giovanni, and Mentore Vaccari. 2022. Solid Waste Management in Rural Communities of Developing Countries: An Overview of Challenges and Opportunities. https://doi.org/10.3390/cleantechnol4040069.
- (30) Ministry of Women, Family and Community Development. 2021. Statistics on Women, Family and Community. https://www.kpwkm.gov.my/kpwkm/uploads/files/Penerbitan/Buku%20Perangkaan/e-book%E2%80%A2KPWKM%202020-2021%20291122.pdf.r=column/cthemeByCat&cat=509&bul_id=ZFRzTG9ubTkveFR4YUY2OXdNNk1GZz09&menu_id=L0pheU43NWJwRWVSZklWdzQ4TlhUUT09.
- (31) New Straits Times. 2022. Can Malaysia achieve 40 per cent recycling rate by 2025?. https://www.nst.com.my/news/nation/2022/03/778625/can-malaysia-achieve-40-cent-recycling-rate-2025.
- (32) Ministry of Foreign Affairs of the Netherlands. 2021. Circular Economy Opportunities in Malaysia. https://www.rvo.nl/sites/default/files/2022/03/Malaysia%20Booster%20Programme.pdf.
- (33) New Straits Times. 2022. New sustainability commitments an opportunity to uplift Malaysia's informal sector. https://www.nst.com.my/opinion/columnists/2022/11/849477/new-sustainability-commitments-opportunity-uplift-malaysias.
- (34) Ministry of Economic Affairs. 2019. Shared Prosperity Vision 2030 (SPV 2030): Restructuring Malaysia's Development Priorities. https://www.epu.gov.my/sites/default/files/2020-02/Shared%20Prosperity%20Vision%202030.pdf.
- (35) UN Department of Economic and Social Affairs. 2022. SDG Indicators Database. https://unstats.un.org/sdgs/dataportal/database.
- (36) Ministry of Natural Resources, Environment and Climate Change. 2022. Malaysia’s Fourth Biennial Update Report. https://unfccc.int/sites/default/files/resource/MY%20BUR4_2022.pdf.
- (37) Nor Faiza M.T., Noor Artika H. and Yusof M.Z.. 2019. Health Care Waste Management and Sustainable Development Goals in Malaysia. https://jwbm.com.my/archives/1jwbm2019/1jwbm2019-18-20.pdf.
- (38) Muhamad Azahar Abas, et al. 2022. Technology adoption for municipal solid waste management (MSWM) in Malaysia. https://www.researchgate.net/publication/361272960_Technology_adoption_for_municipal_solid_waste_management_MSWM_in_Malaysia.
- (39) Government of Malaysia. 1974. Law of Malaysia, Act 127, Environment Quality Act 1974. https://www.env.go.jp/en/recycle/asian_net/Country_Information/Law_N_Regulation/Malaysia/Malaysia_mal13278.pdf.
- (40) UNEP. 2019. When waste works for women. https://www.unep.org/news-and-stories/story/when-waste-works-women.
- (41) DOSM. 2022. Compedium of Environmental Statistics 2022. https://newss.statistics.gov.my/newss-portalx/ep/epFreeDownloadContentSearch.seam?contentId=173474&actionMethod=ep%2FepFreeDownloadContentSearch.xhtml%3AcontentAction.doDisplayContent&cid=62872.
- (42) US International Trade Administration. 2023. MALAYSIA WASTE MANAGEMENT SOLUTIONS. https://www.trade.gov/market-intelligence/malaysia-waste-management-solutions#:~:text=According%20to%20the%20National%20Solid,is%20done%20to%20reduce%20waste.
- (43) Department of Environment, Malaysia. List of licensed scheduled waste facility/ transporter. https://eswis.doe.gov.my/facilitylist.aspx.
- (44) The Malay Mail. 2019. Selangor aims to improve recycling practice. https://www.malaymail.com/news/malaysia/2019/11/02/selangor-aims-to-improve-recycling-practice/1806250.
- (45) Government of Malaysia. 2022. Malaysia's Update of its Nationally Determined Contribution. https://unfccc.int/sites/default/files/NDC/2022-06/Malaysia%20NDC%20Updated%20Submission%20to%20UNFCCC%20July%202021%20final.pdf.
- (46) Department of Statistics Malaysia, 2022. Labour Force Statistics Report https://www.dosm.gov.my/v1/uploads/files/1_Articles_By_Themes/Labour_Force/Monthly/2022/LABOUR%20FORCE%20REPORT%20MARCH%202022.pdf2
- (47) Department of Statistics Malaysia, 2023. Annual Economic Statistics Subsector Water Supply, Sewerage, Waste Management and Remediation Activities https://www.dosm.gov.my/portal-main/release-content/3f64779d-8ba9-11ed-96a6-1866daa77ef9
- (48) DOSM. 2023. Employment Statistics. https://www.dosm.gov.my/portal-main/release-content/c77dc3c3-8b7c-11ed-96a6-1866daa77ef9.
- (49) Kong et al. 2020. Socio-Economic Factors Related to Drinking Water Source and Sanitation in Malaysia. https://www.ncbi.nlm.nih.gov/pmc/articles/PMC7672613/
- (50) Lukman et al. 2022. Solid Waste Disposal Practices Among Rural Community in Pasir Mas, Kelantan, Malaysia. https://iopscience.iop.org/article/10.1088/1755-1315/1102/1/012081
- (51) Soomro et al. 2023. Understanding barriers and motivations in solid waste management from Malaysian industries: a comparative analysis. https://link.springer.com/article/10.1007/s11356-022-22558-z
- (54) Signal Hire. 2023. Arachem (M) Sdn Bhd Overview. https://www.signalhire.com/companies/arachem-m-sdn-bhd
- (52) Tomra. 2023. About Tomra. https://www.tomra.com/en.
- (53) Zippia. 2023. Eriez Revenue. https://www.zippia.com/eriez-careers-22731/revenue/
- (55) Government of Malaysia. Industry4WRD Policy. 2018. https://www.miti.gov.my/index.php/pages/view/48322
- (56) Government of Malaysia. Economic & Fiscal Outlook and Federal Government Revenue Estimates 2023. 2023. https://budget.mof.gov.my/pdf/belanjawan2023/ekonomi-fiskal/EUFORE2023_270223.pdf