


Integrated Waste Management for Commercial and Household Waste
Integrated Waste Management for Commercial and Household Waste
Business Model Description
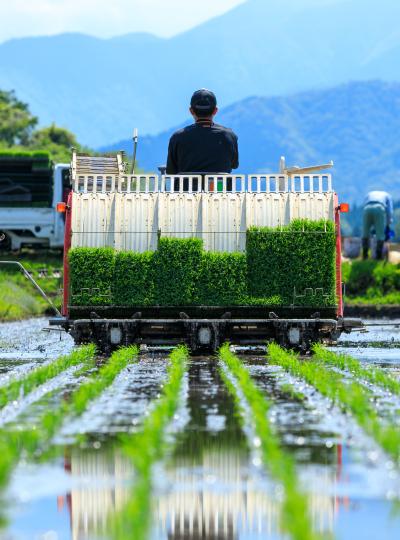
Provide modern waste management systems, including material recovery facility, treatment and processing, through B2B / B2C models. Examples of some companies active in this space:
PT. Wahana Anugerah Energy (Rapel), founded in 2019, offers an on-demand household and industrial waste collection solution for recyclable waste which includes inorganic, organic and hazardous waste. It has been acquired by GCAL Limited for ~USD 222,590. (16)
PT Wasteforchange Alam Indonesia, founded in 2014, provides waste management services for corporations and individual customers, including zero waste to landfill, inorganic waste management, event waste management, in-store recycling, digital EPR and the like. In 2020, it raised USD 3 mn in a growth round from East Ventures Co., Ltd., Sinar Mas Digital Ventures, and Agaeti Venture Capital.
PT Magalarva Sayana Indonesia, founded in 2017, produces sustainable protein for animal feed by bio-converting organic waste using black soldier fly. In 2019, it raised USD 500,000 in a Venture round from an unnamed Indonesia-based multinational company.
Expected Impact
Waste management to reduce environment degradation (from disposal of waste on land and in water), resulting in sustainable development of economy.
How is this information gathered?
Investment opportunities with potential to contribute to sustainable development are based on country-level SDG Investor Maps.
Disclaimer
UNDP, the Private Finance for the SDGs, and their affiliates (collectively “UNDP”) do not seek or solicit investment for programmes, projects, or opportunities described on this site (collectively “Programmes”) or any other Programmes, and nothing on this page should constitute a solicitation for investment. The actors listed on this site are not partners of UNDP, and their inclusion should not be construed as an endorsement or recommendation by UNDP for any relationship or investment.
The descriptions on this page are provided for informational purposes only. Only companies and enterprises that appear under the case study tab have been validated and vetted through UNDP programmes such as the Growth Stage Impact Ventures (GSIV), Business Call to Action (BCtA), or through other UN agencies. Even then, under no circumstances should their appearance on this website be construed as an endorsement for any relationship or investment. UNDP assumes no liability for investment losses directly or indirectly resulting from recommendations made, implied, or inferred by its research. Likewise, UNDP assumes no claim to investment gains directly or indirectly resulting from trading profits, investment management, or advisory fees obtained by following investment recommendations made, implied, or inferred by its research.
Investment involves risk, and all investments should be made with the supervision of a professional investment manager or advisor. The materials on the website are not an offer to sell or a solicitation of an offer to buy any investment, security, or commodity, nor shall any security be offered or sold to any person, in any jurisdiction in which such offer would be unlawful under the securities laws of such jurisdiction.
Country & Regions
- Indonesia: Countrywide
- Indonesia: Java
- Indonesia: Sumatra
- Indonesia: Sulawesi
Sector Classification
Infrastructure
Development need
To achieve the GDP growth target, infrastructure spending should reach ~USD 450 bn, while GoI has allocated 37% from the state budget (1). In 2019, Indonesia was able to reduce, reuse, and recycle ~14.58% of its waste, while 34.6% was dumped in landfills or incinerated, thereby bringing the national waste management to 49.18%. (2)
Policy
Presidential Regulation No. 97 of 2017 establishes national waste management policies and strategies known as JAKSTRANAS, which target to reduce waste by 30% and to handle the remaining 70% by 2025. These targets apply to all household and household-related waste, including food, textile, and plastic waste. (3)
Gender inequalities and marginalization issues
63% workers in local "waste bank" communities are women, actively participating in waste bank management. (4)(5) By gaining financial assistance and training on waste management education, women collectors can become efficient contributors to their household incomes.
~60% women are in-charge of household waste management, while ~40% of men are involved in this activity. (6) Women are also burdened by household responsibilities, and thus, vulnerable to environmental damage, which in turn can undermine their capacity to provide food and clean water for their families, subsequently, leading to an increase in their domestic workload. (7)
Investment opportunities introduction
The success rate for handling national waste reached 67.4%, against the target of 80%. In addition to waste handling data, urban household access to waste management services reached 59.08% for handling and 1.55% for reduction. (8)
Key bottlenecks introduction
Uncontrolled urbanization and unintegrated city development may cause a hindrance to infrastructure planning.
Indonesia bears the highest disaster risk in the world, which necessitates the need for climate-resilient housing. (9) Many people insist on living in dense urban areas despite poor housing conditions to access jobs and save on transport. (10)
Waste Management
Development need
Waste management infrastructure and technology is not adequate to meet Indonesia’s rate of waste production, i.e. ~190,000 tons of waste each day. ~20% of plastic waste (~25,000 tons) ends up in rivers and coastal areas. (11)
In 2021, ~39%-54% of Indonesia’s waste was properly managed, resulting in ~30-40 mn tonnes of waste (3-4 mn plastic) into the environment annually. (12)
Policy
Waste management is accommodated in National Priority 6 - improving the environment, disaster and climate resilience, Priority program - improving the environmental quality through several strategies for example, for household and industrial waste management. GoI has also set a target to reduce plastic waste by 70% by 2025. (1)
Gender inequalities and marginalization issues
Indonesian women play a significant role in making household purchasing decisions and in the day-to-day management of waste in most households. They are more exposed to the negative effects of plastic pollution, including direct exposure to emissions from waste burning or dumping.
Jobs in government-run waste management at supervisory levels are predominantly held by men, even though waste sorting is often handled by women workers. Female workers in the informal sector waste system are exposed to health and safety risks, workplace violence and discrimination. (13)
Investment opportunities introduction
The Indonesian waste management industry had total revenues of USD 140.8 mn and industry consumption volume reached a total of 23.9 bn tons in 2019. (14) Indonesia’s e-waste generation is projected to increase from 2.0 (2021) to 3.2 mn tones (2040), which represents economic values from US 2.2 bn to USD 14 bn (15)
Key bottlenecks introduction
Public budget for waste infrastructure and technology is quite low due to limited fiscal capacity. At the same time, households' willingness to pay for waste handling or management is also low as waste management is assumed to be the Government's responsibility.
Waste Management
Pipeline Opportunity
Integrated Waste Management for Commercial and Household Waste
Provide modern waste management systems, including material recovery facility, treatment and processing, through B2B / B2C models. Examples of some companies active in this space:
PT. Wahana Anugerah Energy (Rapel), founded in 2019, offers an on-demand household and industrial waste collection solution for recyclable waste which includes inorganic, organic and hazardous waste. It has been acquired by GCAL Limited for ~USD 222,590. (16)
PT Wasteforchange Alam Indonesia, founded in 2014, provides waste management services for corporations and individual customers, including zero waste to landfill, inorganic waste management, event waste management, in-store recycling, digital EPR and the like. In 2020, it raised USD 3 mn in a growth round from East Ventures Co., Ltd., Sinar Mas Digital Ventures, and Agaeti Venture Capital.
PT Magalarva Sayana Indonesia, founded in 2017, produces sustainable protein for animal feed by bio-converting organic waste using black soldier fly. In 2019, it raised USD 500,000 in a Venture round from an unnamed Indonesia-based multinational company.
Business Case
Market Size and Environment
> USD 1 billion
5% - 10%
GoI's target for 2025- 30% waste reduction; 70% waste handling, 70% marine debris reduction. (3)
Solid Waste Management Systems require ~USD 18 bn in capital investment between 2017 and 2040 and an estimated annual increase of USD 1 bn in operational financing by 2040. (17)
Indonesia generates ~6.8 mn tonnes of plastic waste per year which is growing by 5% annually. (17) Plastic pollution is expected to increase at 30% by 2025 and ~2x by 2040. (17)
Waste management industry consumption volume (i.e. total MSW generation) increased by 1% CAGR between 2015 and 2019, to reach a total of 23.9 bn tons in 2019. Moderate growth in the industry in 2019 is associated with low landfill use due to environmental awareness. (14)
Indicative Return
> 25%
> 25%
Waste management plants can operate with: Minimum volume of 50 tonnes per day; Estimated capex ~USD 12,225 per tonnes for segregating and transporting; Waste treatment at USD 35,000 per tonnes; Waste to energy USD 94,000 per ton (RDF/coal substitution); Recycle economies of scale at 10-20 tonnes per day.
Waste4Change reported Net Profit Margin of 5-15% and Cost of Good Sold of 60%.
Private Equity firms target 20-25% IRRs on their investment. Returns depend on stage of investment and the valuation at the time of exit. Example: Seed fund investors will earn a better return if they hold their investment, than the investors who enter at a later stage.
Investment Timeframe
Short Term (0–5 years)
Players in this segment are relatively new, and have already reported profits. Concession Period for waste to energy project: > 10 years Experts suggest that additional capital may be required for expansion: ~USD 55,887 to 69,860 (including warehouse, machine, transportation and rent)
Ticket Size
< USD 500,000
Market Risks & Scale Obstacles
Efficiency Risk
Stakeholder risk
Uptake risk
Impact Case
Sustainable Development Need
Need for transforming waste collection and recycling process through a multi-step development programme, including a circular based collection, recycling and processing system, supporting both waste producers, waste workers/collectors as well as the recycling industry and society at large.
Inadequate municipal waste collection/disposal systems have resulted in significant leakage of plastic waste into the environment. Of 65.79 mn tonnes of Municipal Solid Waste generated in 2018, 44% was food waste, 15% plastics, 13% yard waste/leaves, 11% paper, 3% textile, 2% each of metal, rubber, glasses. (18)
Protection of life on earth through proper waste management. Plastic debris was found in the stomachs of ~100% sea turtle hatchlings. Oil spills cause catastrophic habitat degradation and decimate wildlife populations.(19) Indonesia discharges ~85,000 tons of plastic into the sea annually. (20)
Gender & Marginalisation
Promote equality by improving the livelihood of waste collectors by formalizing their job status and improving income levels. Currently, waste pickers often work for below optimal wages and work in unsafe conditions.
Support women communities that initiate communications and discussions on waste in their neighborhoods (waste education) which would help in proper segregation of waste collected.
Expected Development Outcome
Improved waste collection and increase in proportion of waste that is recycled to help reduce the rate of mismanagement and dumping of waste with overall positive outcomes for the environment.
Enhanced public awareness and consciousness regarding waste management related challenges, civil society ownership and responsibilities, specifically regarding recycling of materials such as plastics.
Protecting public health through ensuring a clean environment, reduction in medical waste, minimizing inorganic waste and waste management education.
Gender & Marginalisation
Improved work conditions for waste collectors/workers by providing them direct access to source segregated waste, by provision of tools and by the provision of training and education.
Empower women (63% workers in local waste bank communities are women) financially by providing training and waste management education to women collectors. (4)
Primary SDGs addressed
11.6.1 Proportion of municipal solid waste collected and managed in controlled facilities out of total municipal waste generated, by cities
11.6.2 Annual mean levels of fine particulate matter (e.g. PM2.5 and PM10) in cities (population weighted)
Proportion - 53.55 Amount of waste (Ton) Waste levels - 36,541,719.34 Managed waste - 19,567,380.96 (21)
Parameter - PM 10 Quality Standards - 150 μg/m3 Results - < 50 μg/m3 (21)
% of households in urban areas that are served by waste management: 2021: 73.70 handling and 5.51 reduction (RKP 2021) 2022: 75.28 handling and 9.13 reduction (Ranwal RKP 2022) 2023: 77.64 treatment and 14.57 reduction (RPJMN 2020-2024) 2024: 80 handling and 20 reduction % of national waste that are managed: 2021: 67.10 mn ton 2022: 1 mn ton 2023: 69.2 mn ton 2024: 69.8 mn ton (22)
Yearly average particulate matter PM10 concentrations: 2021 to 2024: < 40 (Good condition) Air quality index: 2021: 84.2 2022: 84.3 2023: 84.4 2024: 84.5 (22)
Secondary SDGs addressed
Directly impacted stakeholders
People
Gender inequality and/or marginalization
Planet
Corporates
Public sector
Indirectly impacted stakeholders
People
Gender inequality and/or marginalization
Planet
Public sector
Outcome Risks
Risk of low uptake by households and people since benefits from improved waste management is intangible and requires behavior change and strict laws governing waste disposal.
The models need to be expanded across all densely populated geographies to realize economies of scale. Thus, thinly populated areas and rural areas may remain unserved, leading to imbalances in waste management.
Business models, at a time, can deploy technology only for one type of waste recycling/processing, thus resulting in exclusion of certain categories of waste.
Gender inequality and/or marginalization risk: In the absence of sufficient regulations / controls waste workers/ collectors stand to be exposed to exploitative practices by operators.
Impact Risks
Waste management cost is high as existing infrastructure covers ~60-70% of the population and doesn't provide adequate structures, including equipment for storage, collection and segregation.
Scaling up of such business models without adequate safety, capacity building and income security measures for waste picker communities can lead to further marginalization challenges.
Gender inequality and/or marginalization risk: Lack of private participation in this sector will aggravate the burden on the Government to spend on waste management and environment conservation.
Impact Classification
What
Efficient waste management to reduce the level of untreated waste and promote sustainable development
Who
Various; Population at large benefits from proper waste disposal and treatment; waste workers benefit from improved livelihood
Risk
People may not be willing to pay for such services; economies of scale can only be realized of operations are expanded to widely populated areas.
Contribution
Scaling up of business models under this IOA can help manage the expected increase in plastic pollution - 30% by 2025; and 2x by 2040 (17)
How Much
In 2019, revenue of waste management industry was USD 140.8 mn. (14) Plastic value chain market is expected to reach USD 10 bn (revenue) in the next 20 years. (17)
Impact Thesis
Waste management to reduce environment degradation (from disposal of waste on land and in water), resulting in sustainable development of economy.
Enabling Environment
Policy Environment
Presidential Regulation No. 98 of 2021 on the Implementation of Carbon Economic Value: prescribes mitigation and adaptation actions as the 2 main methods to tackle climate change and achieve Nationally Determined. Contribution (NDC). (24)
Presidential Regulation No. 98 of 2021: introducing the concept of “carbon economic value", it develops a regulatory framework on carbon pricing and carbon trading arrangements (including registration and valuation, economic incentives and carbon levies and taxes). (24)
2020-2024 MOEF Strategic Plans: stipulates that pollution control will be carried out by household waste and plastic waste handling, building integrated Hazardous (B3) and medical waste processing facilities (25)
The GoI has set targets to achieve several key indicators by 2024 - amount of managed waste nationally (339.4 mn tons); decrease of waste that ended in the sea (60% of the baseline); and the amount of B3 waste management (539.8 mn tons). (25)
Ministry of Environment and Forestry Regulation 75/2019: Under the Roadmap to Plastic Waste Reduction by Producers, GoI signals its important commitment to reduce avoidable plastic use. (26)
Financial Environment
Financial incentives: New pioneer industry investment can get tax holiday facilities - 100% income tax reduction - in 5-20 years with investment of USD 35 mn-2 bn, and mini tax holiday -50% income tax reduction - in 5 years with investment of USD 7-34.9 mn. (29)(30)
Fiscal incentives: GoI provides financial support to local government and private institutions through setting up a state budget for waste management at the local level, including waste reduction, reusing, recycling, transporting, and processing. (28)
Other incentives: MoF Regulation No. 26/PMK.07/2021 concerning Funding Support for the State Revenue and Expenditure Budget for Waste Management in the Regions sets financial support, including regional incentive funds (DID) and physical and non physical special allocation funds (DAK). (28)
Regulatory Environment
Presidential Regulation No. 97/2017 on Indonesia National Strategy Policy on Managing Domestic Waste and Domestic Waste Equivalents (Jakstranas): becomes Roadmap towards the 2025 Clean-from-Waste Indonesia. (3)
Presidential Regulation No. 97/2017 (Jakstranas): Waste management is implemented through strengthening coordination between central and local government, information system development, incentives and disincentives system development. (3)
Ministry of Trade Regulation No. 31/2016: states the provisions for import of non-hazardous waste, especially plastic waste, including an import approval mechanism and verification due to increased national competitiveness to meet the industrial needs for using recycled raw materials. (27)
Ministry of Finance tries to respond to the waste problem through fiscal policy by providing incentives to local governments and ministries/institutions (K/L), including under their Regulation No.26/2021 concerning Fund Support and Expenditure Budget for Waste Management. (28)
Presidential Regulation No.98/2021: Indonesia is targeting a 29% reduction in greenhouse gas emissions on its own by 2030. It also announced Result-Based Payment as an incentive or payment obtained from verified and/or certified GHG emission reduction results and validated non-carbon benefits. (24)
Marketplace Participants
Private Sector
Corporates: PT Magalarva Sayana Indonesia, Rapel.id, Waste4Change Investors: GCAL Limited, East Ventures, Agaeti Ventures dan SMDV
Government
Ministry of Environment and Forestry, Ministry of Finance, Ministry of Marine Affairs and Fisheries, Minister of Energy and Mineral Resources, Minister of Industry, Minister of Transportation, Minister of Agriculture, Indonesia Environmental Fund Agency (BPDLH)
Multilaterals
United Nations Development Programme (UNDP), Food and Agriculture Organization (FAO), Japan International Cooperation Agency (JICA), World Bank, International Finance Corporation (IFC), ASEAN Infrastructure Fund (AIF), Islamic Development Bank (IsDB), Asia Development Bank (ADB)
Non-Profit
Aliansi Zero Waste Indonesia (Walhi, Nexus3 Foundation, Zero Waste etc.), Asosiasi Daur Ulang Plastik Indonesia (ADUPI), Ikatan Pemulung Indonesia (IPI)
Public-Private Partnership
KPBU Pengelolaan Sampah Energi Listrik (PSEL) Sarbagita
Target Locations

Indonesia: Countrywide
Indonesia: Java
Indonesia: Sumatra
Indonesia: Sulawesi
References
- (1) Republic of Indonesia. 2020. Indonesia's 2020-2024 National Medium-Term Development Plan (RPJMN). https://perpustakaan.bappenas.go.id/e-library/file_upload/koleksi/migrasi-data-publikasi/file/RP_RKP/Narasi-RPJMN-2020-2024-versi-Bahasa-Inggris.pdf.
- (2) German-Indonesian Chamber of Commerce and Industry (EKONID). 2021. Indonesia’s waste management sector still going strong. https://indonesien.ahk.de/en/infocenter/news/news-details/indonesias-waste-management-sector-still-going-strong#:~:text=According%20to%20data%20from%20the,national%20waste%20management%20to%2049.18%25.
- (3) Republic of Indonesia. 2021. Presidential Regulation (Perpres) No.97/2017 concerning Indonesian National Strategy Policy on Managing Household Waste and Household Waste Equivalents (JAKSTRANAS). https://kkp.go.id/an-component/media/upload-gambar-pendukung/djprl/P4K/Pencemaran%20Laut/Marine%20Debris/03.%20Perpres%20Nomor%2097%20Tahun%202017%20-%20Jakstranas.pdf
- (4) Ministry of Women Empowerment and Child Protection (KEMENPPPA) of the Republic of Indonesia. 2020. TINGKATKAN PEMBERDAYAAN PEREMPUAN MELALUI KREATIVITAS KELOLA SAMPAH RUMAH TANGGA. https://www.kemenpppa.go.id/index.php/page/read/29/3010/tingkatkan-pemberdayaan-perempuan-melalui-kreativitas-kelola-sampah-rumah-tangga
- (5) Agustina Haruki, et al. Pojok Iklim, 2020. Perempuan Pengelola Sampah Selamatkan Bumi. http://pojokiklim.menlhk.go.id/read/perempuan-pengelola-sampah-selamatkan-bumi
- (6) Pradipta, Lengga. Modern Diplomacy, 2021. Making Women Visible in Plastic Waste Management: Examples from Indonesia. https://moderndiplomacy.eu/2021/03/08/making-women-visible-in-plastic-waste-management-examples-from-indonesia/
- (7) Kementerian PPN/Bappenas, Embassy of Denmark Jakarta, UNDP Indonesia. 2021. The Economic, Social and Environmental Benefits of A Circular Economy in Indonesia. https://lcdi-indonesia.id/wp-content/uploads/2021/02/Full-Report-The-Economic-Social-and-Environmental-Benefits-of-a-Circular-Economy-in-Indonesia.pdf
- (8) Republic of Indonesia. 2021. Voluntary National Review For Implementation of New Urban Agenda (Provisional Report). https://www.urbanagendaplatform.org/sites/default/files/2021-10/INDONESIA_Provisional%20Report%20NUA_signed.pdf
- (9) National Disaster Mitigation Agency (BNPB). Potential Disaster Threats. https://www.bnpb.go.id/potensi-ancaman-bencana
- (10) Hart, Maria, and King, Robin. World Resources Institute (WRI), 2019. To Fix City Slums, Don't Just Knock Them Down: Involve Residents in Upgrading Efforts. https://wri-indonesia.org/en/blog/fix-city-slums-dont-just-knock-them-down-involve-residents-upgrading-efforts
- (11) Republic of Indonesia. 2019. Roadmap of SDGs Indonesia Towards 2030. https://www.unicef.org/indonesia/media/1626/file/Roadmap%20of%20SDGs.pdf.
- (12) SYSTEMIQ. 2021. Building Robust Governance and Securing Sufficient Funding to Achieve Indonesia's Waste Management Targets. https://www.systemiq.earth/wp-content/uploads/2021/11/Building-Robust-Waste-System-Governance-and-Securing-Sufficient-Funding_Final-Report_26Nov2021.pdf
- (13) World Economic Report. 2020. Radically Reducing Plastic Pollution in Indonesia: A Multistakeholder Action Plan National Plastic Action Partnership. https://globalplasticaction.org/wp-content/uploads/NPAP-Indonesia-Multistakeholder-Action-Plan_April-2020.pdf
- (14) MarketResearch.com. Waste Management in Indonesia. https://www.marketresearch.com/MarketLine-v3883/Waste-Management-Indonesia-13512533/
- (15) "Mairizal, Aulia et al. Journal of Cleaner Production: 2021. Electronic waste generation, economic values, distribution map, and possible recycling system in Indonesia. https://doi.org/10.1016/j.jclepro.2021.126096"
- (16) Crunchbase. Company Profile & Funding: Rapel. https://www.crunchbase.com/organization/rapel
- (17) Global Plastic Action Partnership. 2020. Press Release: Indonesia National Plastic Action Partnership (NPAP) Reveals Recommendations to Unlock Financing Gaps to Cut Marine Plastic Debris by 70 percent. https://globalplasticaction.org/pressrelease/indonesia-national-plastic-action-partnership-npap-reveals-recommendations-to-unlock-financing-gaps-to-cut-marine-plastic-debris-by-70-percent/
- (18) Ministry of Environment and Forestry (KLHK) of the Republic of Indonesia. Ninth Regional 3R Forum in Asia: Country Presentation - Indonesia. https://www.uncrd.or.jp/content/documents/7611Country%20Presentation_Indonesia_Combined(MoEF&MoI).pdf
- (19) ERC of USA. Environmental Waste Management Explained. https://www.ercofusa.com/blog/what-is-enviornmental-waste-management/
- (20) Rapel. About Us - Rapel. https://www.rapel-id.com/en/about-us/
- (21) Republic of Indonesia. 2021. Voluntary National Review: Annexes. https://sdgs.bappenas.go.id/laporan-voluntary-national-review-vnr-indonesia-2021/
- (22) Kementerian PPN/Bappenas. 2020. Pedoman Teknis Penyusunan Rencana Aksi TPB/SDGs. https://sdgs.bappenas.go.id/wp-content/uploads/2020/10/Buku-Pedoman-Rencana-Aksi-SDGs.pdf
- (23) Republic of Indonesia. 2014. Government Regulation (PP) No. 44/2014, revoking Government Regulation (PP) No.52/2008, concerning Types and Tariffs of Non-Tax State Revenues Applicable to the Ministry of Environment. https://jdih.kemenkeu.go.id/en/dokumen/peraturan/93ef0a32-c0ab-4827-918d-215a56236d79
- (24) Republic of Indonesia. 2021. Presidential Regulation (Perpres) No. 98 of 2021. https://peraturan.bpk.go.id/Home/Details/187122/perpres-no-98-tahun-2021
- (25) Ministry of Environment and Forestry (KLHK). 2020. The Ministry of Environment and Forestry 2020-2024 Strategic Plans. https://www.menlhk.go.id/uploads/site/post/1610950594.pdf
- (26) Ministry of Environment and Forestry (KLHK). 2019. Minister Regulation No.75/2019 concerning the Roadmap to Plastic Waste Reduction by Producers. http://jdih.menlhk.co.id/uploads/files/P_75_2019_PETA_JALAN_SAMPAH_menlhk_12162019142914.pdf
- (27) Ministry of Trade (Kemendag) of the Republic of Indonesia. 2016. Minister Regulation No. 31/2016 concerning the Provisions of Import of Non-hazardous and Non-toxic Waste. https://peraturan.bpk.go.id/Home/Details/128822/permendag-no-31m-dagper52016-tahun-2016
- (28) Ministry of Finance of the Republic of Indonesia. 2021. Minister Regulation No.26/2021 concerning Funding Support for the State Revenue and Expenditure Budget for Waste Management in Regions. https://djpk.kemenkeu.go.id/wp-content/uploads/2021/04/PMK-No.-26-Th-2021.pdf
- (29) Ministry of Finance (MoF) of the Republic of Indonesia. 2020. MoF Regulation No.130/2020, revoking MoF Regulation No.150/2018, revoking MoF Regulation No.35/2018; concerning the Granting of Corporate Income Tax Facilities. https://jdih.kemenkeu.go.id/in/dokumen/peraturan/33b4ea80-8c90-4220-9f84-5696f0fd08df
- (30) Indonesia Investment Coordinating Board (BKPM). 2020. Minister Regulation No.7/2020, revoking Regulation No.1/2019, concerning Details of Business Fields and Types of Production of Pioneer Industries and Procedures for Providing Corporate Income Tax Reduction Facilities. https://jdih-storage.bkpm.go.id/jdih/userfiles/documents/2021/10/2020PerBKPM007.pdf
- (31) Sistem Informasi Pengelolaan Sampah Nasional (SIPSN KLHK). 2021. Capaian Kinerja Pengelolaan Sampah Per Provinsi. https://sipsn.menlhk.go.id/sipsn/public/data/capaian
- (32) FY Prabawa et al. IOP Conference Series: Earth Environmental Science, 2021. Strategy on marine debris reduction in Indonesia: a review and recommendation. https://iopscience.iop.org/article/10.1088/1755-1315/925/1/012027/pdf
- (33) Ministry of Environment and Forestry (KLHK) of the Republic of Indonesia. 2020. The State of Indonesia's Environment. https://www.menlhk.go.id/uploads/site/post/1627019845.pdf