


Integrated Waste Collection & Management Services
Integrated Waste Collection & Management Services
Business Model Description
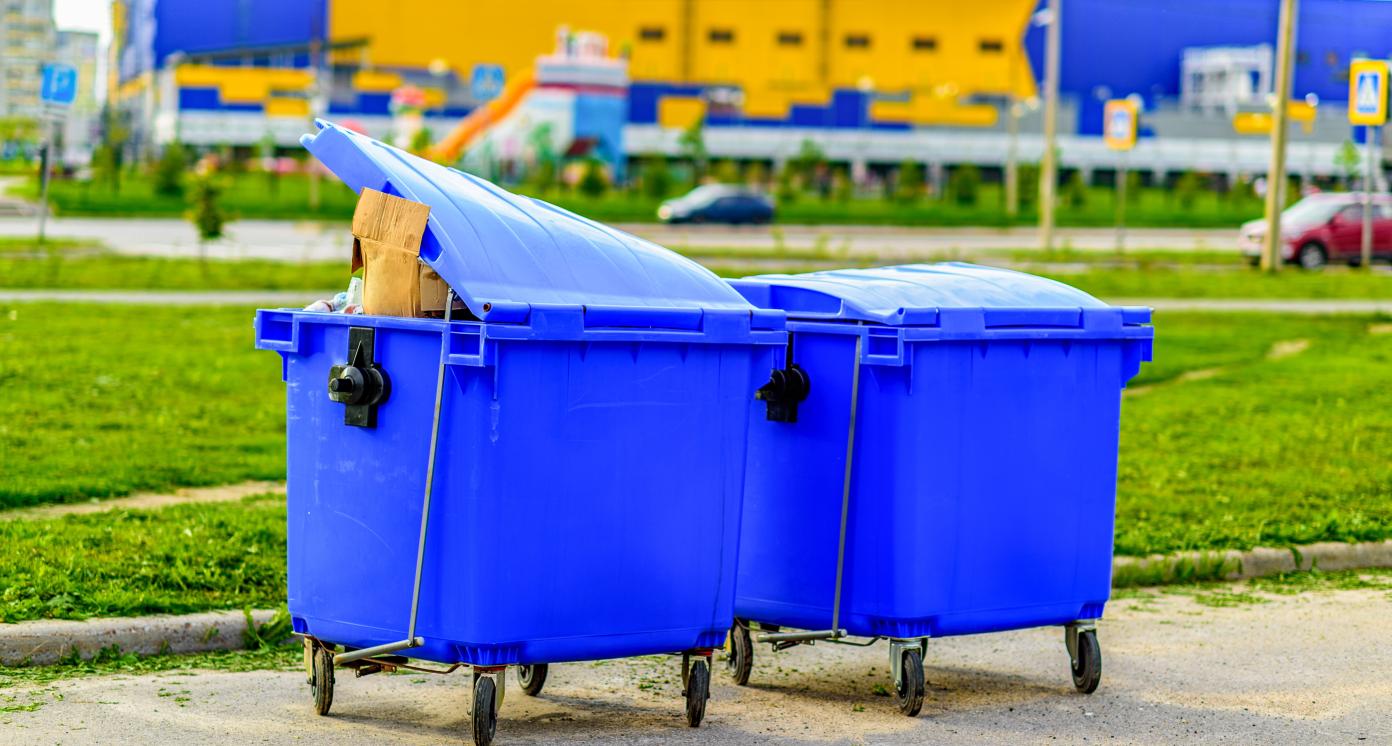
Construct, operate and maintain waste collection and sorting facilities or operate controlled dumpsites under the responsibility of local municipalities through public-private partnerships, which include recycling, composting and disposal of solid waste to prevent open burning practices.
Expected Impact
Decrease the environmental burden of waste, improve resource utilisation, and enhance living conditions and public health.
How is this information gathered?
Investment opportunities with potential to contribute to sustainable development are based on country-level SDG Investor Maps.
Disclaimer
UNDP, the Private Finance for the SDGs, and their affiliates (collectively “UNDP”) do not seek or solicit investment for programmes, projects, or opportunities described on this site (collectively “Programmes”) or any other Programmes, and nothing on this page should constitute a solicitation for investment. The actors listed on this site are not partners of UNDP, and their inclusion should not be construed as an endorsement or recommendation by UNDP for any relationship or investment.
The descriptions on this page are provided for informational purposes only. Only companies and enterprises that appear under the case study tab have been validated and vetted through UNDP programmes such as the Growth Stage Impact Ventures (GSIV), Business Call to Action (BCtA), or through other UN agencies. Even then, under no circumstances should their appearance on this website be construed as an endorsement for any relationship or investment. UNDP assumes no liability for investment losses directly or indirectly resulting from recommendations made, implied, or inferred by its research. Likewise, UNDP assumes no claim to investment gains directly or indirectly resulting from trading profits, investment management, or advisory fees obtained by following investment recommendations made, implied, or inferred by its research.
Investment involves risk, and all investments should be made with the supervision of a professional investment manager or advisor. The materials on the website are not an offer to sell or a solicitation of an offer to buy any investment, security, or commodity, nor shall any security be offered or sold to any person, in any jurisdiction in which such offer would be unlawful under the securities laws of such jurisdiction.
Country & Regions
- Eswatini: Countrywide
- Eswatini: Countrywide
- Eswatini: Countrywide
Sector Classification
Infrastructure
Development Need
Limited infrastructure is identified as a key contributor to poverty and a major obstacle to inclusive development. 35% of road infrastructure are in poor condition, housing, water and waste management are of poor quality, and physical infrastructure is poorly maintained, which curtails growth, prosperity, investment inflows, trade and employment (1, 2).
Policy Priority
Policy priority: The National Development Plan (NDP) and Kingdom of Eswatini Strategic Roadmap 2019-2022 highlight efficient economic infrastructure network as a prioritized national outcome and emphasize investments in infrastructure for improved public and private sector activity to support socioeconomic development (1, 3).
Gender inequalities and marginalization issues
Existing infrastructure such as water, sanitation and hygiene, waste management, road infrastructure and ICT infrastructure in rural and low-income areas is significantly underdeveloped compared to urban and affluent areas and do not address the socio-economic development needs of the poor, with increasing pressure placed on infrastructure in rural areas and expanding low income urban settlements, resulting from urbanization (1, 4).
Investment opportunities introduction
Key investment opportunities for infrastructure in Eswatini include housing, ICT, transportation, water and sanitation, waste management, energy utilities as well as sector specific infrastructure for healthcare facilities, education centers and industries that stimulate economic growth (1, 5).
Key bottlenecks introduction
Fiscal challenges faced by government resulting in limited public expenditure capacity on infrastructure as well as rapid urbanization and extreme climatic conditions place increasing pressure on existing infrastructure (1, 5).
Waste Management
Development need
The growing waste management problem in Eswatini can be seen as a symptom of industrialization, urbanization, and population growth. Waste collection is limited to urban areas, while rural areas are subject to open-burning, contributing to increased GHG emissions and pollution (18). Plastic waste is also a major threat to the country’s ecosystem especially in rural areas (6).
Policy priority
The Eswatini Environment Authority's primary mandate is to address the issues of growing waste management problem with the use of a holistic approach in waste management, focusing on waste prevention and minimization (8). The Kingdom of Eswatini Strategic Roadmap 2019-2022 also takes plastic waste into consideration, discouraging the use of plastic bags (3).
Gender inequalities and marginalization issues
Growing need for waste management is more visible in rural areas of Eswatini, such as Zikhotheni and Zombodze (Shiselweni) where communities do not have access to waste collection services, and resort to open waste burning or burying. Rural regions that rely on agriculture for livelihoods are more sensitive to pollution caused by lack of waste management (7).
Investment opportunities introduction
Government aims to create special industrial zones for MSMEs to take advantage of manufacturing opportunities, including recycling, while metal recycling is highlighted as an opportunity with a planned E 50 million (USD 3 million) investment from the government (9).
Key bottlenecks introduction
Limited coverage of existing waste management systems, prevalence of informal burning practices and widespread use of plastic material hindering regulation and control, limited land availability due to tenure system are key bottlenecks for waste management interventions.
Waste Management
Pipeline Opportunity
Integrated Waste Collection & Management Services
Construct, operate and maintain waste collection and sorting facilities or operate controlled dumpsites under the responsibility of local municipalities through public-private partnerships, which include recycling, composting and disposal of solid waste to prevent open burning practices.
Business Case
Market Size and Environment
45% of Eswatini's waste is openly burnt and the textile industry generates 402 tons of waste per month
According to the Waste Characterization Report of 2021, Eswatini's national waste generation per capita was averaged at 27.9 g / day / capita (6). Of the total waste generated in Eswatini, 45% was openly burnt, 25% was sent to landfills and almost 30% was recycled (6).
402 tons of textile waste was generated per month at the Matsapha Industrial Estate, where 80% of Eswatini's garment and textile factories are located (14).
Diverting waste away from dumpsites and landfills towards reuse, recycling and recovery could inject an additional USD 8 billion every year into the African economy, and create significant socio-economic opportunities for the continent (13).
Indicative Return
15% - 20%
Benchmark projects from Turkish waste collection enterprises and sorting facilities exhibit IRRs of 10-15%. South African waste reuse solutions indicate IRRs of 20-25% (30).
A study on the waste management services in the Kwaluseni area (Manzini) reported a willingness-to-pay for waste management services averaging at E 47.71 (USD 3) per month and household (14).
Investment Timeframe
Short Term (0–5 years)
Waste collection and sorting facilities require less technologically intense investments and can generate return in a short-term period.
Ticket Size
USD 1 million - USD 10 million
Market Risks & Scale Obstacles
Capital - Requires Subsidy
Business - Supply Chain Constraints
Market - Highly Regulated
Impact Case
Sustainable Development Need
Of the total waste generated in Eswatini, 45% was openly burnt, 25% was sent to landfills and almost 30% was recycled (6). With a national waste generation per capita calculated to be 27.9 g / day / capita (6), the growing waste management need has been accelerated by the pressure of population growth coupled with a lack of existing waste management infrastructure (8).
Degradable waste, especially food waste, is the major waste component in the waste generated from both households as well as in dumpsites and landfills (6).
With almost 80% of the textile and garment factories located in the Matsapha Industrial Estate, generated waste reach 402 tons per month in this area, with a collection efficiency of only 36% (137 tons), with the reminder often landing in illegal dump sites (14).
Gender & Marginalisation
Waste collection is limited to urban and company towns in Eswatini, while rural areas are marginalized and do not benefit from waste services (6).
Lack of waste management can pose serious hazard to people and public health, especially for low-income and rural communities, with the spread of diseases but also by contaminating soil, water and air (6).
Solid waste management in urban centers is increasingly becoming a problem due to population growth and rapid urbanization, particularly in low-income areas where infrastructure is inadequate (21).
Expected Development Outcome
Integrated waste management services contribute to reducing the risk of diseases linked with unmanaged municipal waste while reducing GHG emissions from open burning practices standing at 45% of total generated waste (29).
Integrated waste collection and management leads to food waste recycling, which avoid food waste (17), overloading of landfills or CO2 emission, and produces nutrient-rich fertilizer or energy. It also creates a recycling industry for export purposes, which can have financial and human gain, as Tunisia and Senegal earned USD 20 million and USD 30 million in 2007 from exports of scrap metal, aluminium and recovered plastics (16).
Gender & Marginalisation
Integrated waste collection and management with a focus on rural areas benefit marginalized populations, who are currently unserved, as well as creates employment opportunities especially for low-skilled workers.
Integrated waste collection and management and the resultant recycling activities reduce burnt and illegal dumping, thus limiting toxic waste and the risks of diseases associated with lack of hygiene infrastructure particularly prominent in rural areas of Eswatini (21).
Primary SDGs addressed
12.5.1 National recycling rate, tons of material recycled
Of the total waste generated, 30% was recycled in 2017 (6).
N/A
11.6.1 Proportion of municipal solid waste collected and managed in controlled facilities out of total municipal waste generated, by cities
Of the total waste generated, 45% was openly burnt, 25% was sent to landfills and almost 30% was recycled in 2017 (6).
N/A
3.9.2 Mortality rate attributed to unsafe water, unsafe sanitation and lack of hygiene (exposure to unsafe Water, Sanitation and Hygiene for All (WASH) services)
27.9 per 100,000 population (2016) (31).
N/A
Secondary SDGs addressed
Directly impacted stakeholders
People
Planet
Corporates
Public sector
Indirectly impacted stakeholders
People
Gender inequality and/or marginalization
Planet
Corporates
Outcome Risks
The existing informal market of waste collectors may be disrupted, which may marginalise smaller and informal waste collectors and lead to a rise in unemployment in the short term.
If interventions do not incorporate an element of recycling or sustainable waste management, waste may end up in limited number of landfills, which may have adverse environmental impacts (21).
Impact Risks
The prevalence of informal waste management practices coupled with a lack of quality sector reporting reduces the measurability of the generated impact (14).
Overlapping mandates of private entities and municipalities caused by the poor regulatory framework prevents effective delivery of waste management services and associated positive impact.
Persistence of informal waste collection and burning practices may limit the expected impact of formalized services on the environment.
Impact Classification
What
Integrated waste collection and management services decreases the environmental burden of waste, improves resource utilisation, and enhances living conditions and public health.
Who
Households residing near landfills, underserved communities, rural population, especially with lack of access to waste management, and the environment benefit from integrated waste collection and management services.
Risk
While the model of integrated waste collection and management services is proven, policy and regulatory frameworks and continued informal waste collection require consideration.
How Much
Integrated waste collection and management services address the national waste generation of 27.9 g / day / capita (6) and the 402 tons of textile waste generated per month (14).
Impact Thesis
Decrease the environmental burden of waste, improve resource utilisation, and enhance living conditions and public health.
Enabling Environment
Policy Environment
National Development Plan, 2019/20 – 2021/22: Strengthens waste management programs and develops a framework to address hazardous waste. The plan emphasizes the adoption of a circular economy to improve recycling and waste separation, as well as mechanisms to access funding (1).
National Environment Policy, 2000: Contains the guiding principles underpinning environmental management in the country, promotes the enhancement, protection and conservation of the environment and the attainment of sustainable development in Eswatini (23, 24).
State of the Environment Report, 2020: Identifies key driving forces that influence environmental change, including waste management; highlights the limitations of state funds allocated for new waste management developments, such as integrated waste management infrastructure (18).
Financial Environment
Financial incentives: The National Environment Fund aims to promote environmental sustainability in Eswatini, with chemical and waste management as the priority areas. It awards grants of up to E 300,000 (USD 20,000), with at least 80% for environmental activities and 20% for administrative tasks (25).
Other incentives: Among the listed projects of the government's Post-Covid-19 Recovery Plan is the planned investment of E 50 million (USD 3.3. million) for a Steel and Metal Recycling Plant (9).
Regulatory Environment
Waste Regulation, 2000: Regulates the management of solid waste and liquid waste in Eswatini. It also provides detailed guidelines on waste management and stipulates fines for failure to comply (22).
Environment Management Act, 2002: Establishes a framework for environment protection, regulates waste licenses, import, export, and trade in waste, as well as waste management’s functions of the Eswatini Environment Authority (EEA), local authorities and waste service providers (19).
Litter Regulations, 2011: Regulates prohibition of littering, manages litter offences, and grants responsibility to different entities for the provision of waste receptacles (26).
Legal Notice No. 324 the Public Procurement Act, 2020: Regulates the procurement of goods, works and services by procuring entities, including for waste management, to ensure transparency, accountability and promote diverse private sector participation in public procurements (28).
Marketplace Participants
Private Sector
Envirowise Waste Management, Eco-Buzz, Eric Slabbert Agencies, Eclipse Environmental Solutions.
Government
Eswatini Environment Authority (Ministry of Tourism, Environment and Communication), Ministry of Housing and Urban Development, Ministry of Natural Resources and Energy, Water Services Corporation, City Councils.
Multilaterals
United Nations Development Programme (UNDP), UN Environment, Food and Agriculture Organisation (FAO), United Nations Industrial Development Organization (UNIDO), African Development Bank (AfDB).
Non-Profit
Institute of Waste Management of Eswatini (IWMEswatini).
Public-Private Partnership
Eclipse Environmental Solutions, a municipal and landfill waste management company, has been awarded the contract for the maintenance of the Manzini Controlled Dumpsite by the Municipal Council of Manzini with a contact volume of E 4.2 million (USD 279,000) (12).
Target Locations

Eswatini: Countrywide
Eswatini: Countrywide
Eswatini: Countrywide
References
- (1) Ministry of Economic Planning and Development. 2019. National Development Plan (NDP) 2019/20-2021/22. http://www.gov.sz/images/CabinetMinisters/NDP-2019-20-to-2021-22-final.pdf
- (2) Ministry of Economic Planning and Development. 2017. The Strategy for Sustainable Development and Inclusive Growth (SSDIG). Offline
- (3) Government of Eswatini. 2019. Kingdom of Eswatini Strategic Roadmap 2019-2022. http://www.gov.sz/images/CabinetMinisters/STRATEGIC-ROADMAP-2018-2023---MAY-2019.pdf
- (4) Ministry of Economic Planning and Development. 2019. Voluntary National Review. https://sustainabledevelopment.un.org/content/documents/24651Eswatini_VNR_Final_Report.pdf
- (5) Ministry of Tourism and Environmental Affairs & Ministry of Economic Planning and Development. 2021. Kingdom of Eswatini’s Revised Nationally Determined Contributions (Offline)
- (6) UNDP & Eswatini Environment Authority. December 2021. Waste management and livelihoods projects: Waste Characterization. Offline
- (7) Sizwe M. Nxumalo et al. 2020. Plastic waste management practices in the rural areas of Eswatini. https://www.sciencedirect.com/science/article/pii/S2590291120300553#bib12
- (8) Eswatini Environment Authority. 2022. Waste Management. https://eea.org.sz/waste-management/
- (9) Government of Eswatini. 2020. Post COVID-19 Kingdom of Eswatini Economic Recovery Plan. http://www.gov.sz/images/CORONA/FINAL-POST-COVID-19-ECONOMIC-RECOVERY-PLAN-ESWATINI-14082020_compressed.pdf
- (10) Eric Slabbert Agencies (Pty) Ltd. 2022. The Kingdom of Eswatini's biggest dry waste recycler. https://off356.wixsite.com/recycling-eswatini
- (11) Eco-Buzz. 2022. https://www.ecobuzzrecyclers.com/
- (12) Times of Swaziland. 2019. Eclipse Wins E 2.4 M Dumpsite Tender. http://www.times.co.sz/business/123916-eclipse-wins-e4-2m-dumpsite-tender.html
- (13) United Nations Environment Programme. 2018. Africa Waste Management Outlook. https://wedocs.unep.org/bitstream/handle/20.500.11822/25515/Africa_WMO_Summary.pdf?sequence=1&isAllowed=y
- (14) Eswatini Environment Authority & UNIDO. August 2018. Kwaluseni Waste Survey Report. https://stopopenburning.unitar.org/site/assets/files/1089/eswatini_kwaluseni_municipality_final_report_on_baseline_study-_aug2018.pdf
- (16) UNEP, 2018, The Future of Waste Management in Africa. https://wedocs.unep.org
- (17) Australian Academy of Science. 2020. Transforming food waste: making something out of rubbish. https://www.science.org.au/curious/earth-environment/transforming-food-waste-making-something-out-rubbish
- (18) Ministry of Tourism and Environmental Affairs, 2020, Restoring the Environment for Climate Resilient Economic Recovery. https://eea.org.sz/wp-content/uploads/2021/12/SOER-FINAL-DRAFT-08.01.2021-ISBN-WEB.pdf
- (19) Government of Eswatini. 2020. The Environment Management Act, 2002. https://eea.org.sz/wp-content/uploads/2021/06/EMA-2002.pdf
- (20) Lex Mercatoria. 1991. Bamako Convention on the Ban of the Import into Africa and the Control of Transboundary Movement and Management of Hazardous Wastes within Africa. https://www.jus.uio.no/lm/hazardous.waste.ban.afrian.import.bamako.convention.1991/portrait.pdf
- (21) Ministry of Tourism and Environmental Affairs & Ministry of Economic Planning and Development. 2021. Kingdom of Eswatini’s Revised Nationally Determined Contributions (Offline)
- (22) FAO. 2000. Waste Regulations, 2000 (L.N. No. 31 of 2000). https://www.fao.org/faolex/results/details/en/c/LEX-FAOC042649/
- (23) Government of Eswatini. 2020. National Environmental Policy. Draft. http://eea.org.sz/wp-content/uploads/2020/08/ne_policy.pdf
- (24) Swaziland Environment Authority. 2017. National Inventory on Open Burning Practices and Unintentional Persistent Organic Pollutants (UPOPS) Releases. https://stopopenburning.unitar.org/site/assets/files/1089/eswatini-_inventory_report_for_open_burning_project-_oct2017.pdf
- (25) Grants and Resources for Sustainability. 2020. Eswatini Environment Fund Call for Proposals. https://www2.fundsforngos.org/latest-funds-for-ngos/eswatini-environment-fund-call-for-proposals/
- (26) Swaziland Government Gazette. 2011. The Litter Regulations, 2011. https://gazettes.africa/archive/sz/2011/sz-government-gazette-supplement-dated-2011-08-12-no-86.pdf
- (27) UNDP Stakeholder Consultation with Eswatini Environment Authority (EEA). February, 2022
- (28) Eswatini Public Procurement Regulatory Agency. Public Procurement Regulations 2020. https://sppra.co.sz/sppra/documents/regulations/Pages%20from%20Eswatini%20Government%20Gazette%20-%2018th%20Dec%202020.pdf
- (29) Center for Science and Environment. 2021. Solid Waste Management in Eswatini. http://www.indiaenvironmentportal.org.in/files/file/Eswatini%20Report%20Jan%202022.pdf
- (30) GreenCape. 2019. Waste Market Intelligence Report. https://www.greencape.co.za/assets/Uploads/WASTE-MARKET-INTELLIGENCE-REPORT-WEB.pdf
- (31) United Nations Department of Economic and Social Affairs. SDG Indicators. https://unstats.un.org/sdgs/dataportal/database