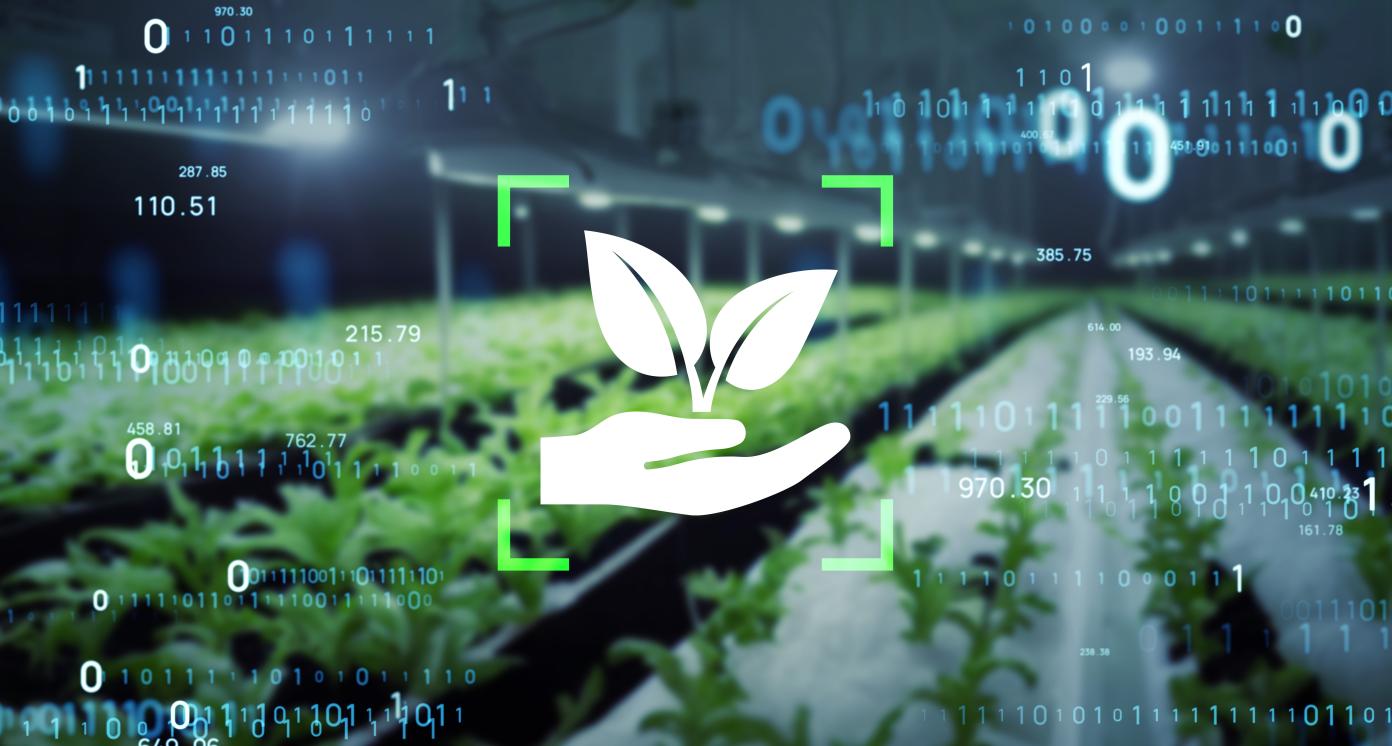
Innovation for Agricultural Production Efficiency

Business Model Description
Optimize the productive efficiency of rural producers through technological solutions that turn them into digital players, facilitating their connection to opportunities in the digital economy.
Expected Impact
Providing technological and innovative solutions to rural producers to enhance their production efficiency
How is this information gathered?
Investment opportunities with potential to contribute to sustainable development are based on country-level SDG Investor Maps.
Disclaimer
UNDP, the Private Finance for the SDGs, and their affiliates (collectively “UNDP”) do not seek or solicit investment for programmes, projects, or opportunities described on this site (collectively “Programmes”) or any other Programmes, and nothing on this page should constitute a solicitation for investment. The actors listed on this site are not partners of UNDP, and their inclusion should not be construed as an endorsement or recommendation by UNDP for any relationship or investment.
The descriptions on this page are provided for informational purposes only. Only companies and enterprises that appear under the case study tab have been validated and vetted through UNDP programmes such as the Growth Stage Impact Ventures (GSIV), Business Call to Action (BCtA), or through other UN agencies. Even then, under no circumstances should their appearance on this website be construed as an endorsement for any relationship or investment. UNDP assumes no liability for investment losses directly or indirectly resulting from recommendations made, implied, or inferred by its research. Likewise, UNDP assumes no claim to investment gains directly or indirectly resulting from trading profits, investment management, or advisory fees obtained by following investment recommendations made, implied, or inferred by its research.
Investment involves risk, and all investments should be made with the supervision of a professional investment manager or advisor. The materials on the website are not an offer to sell or a solicitation of an offer to buy any investment, security, or commodity, nor shall any security be offered or sold to any person, in any jurisdiction in which such offer would be unlawful under the securities laws of such jurisdiction.
Country & Regions
- Macroregion Norte
- Macroregion Sur
- Region Lima y Callao
Sector Classification
Food and Beverage
Development needs
- The agricultural sector's GDP contribution in 2022 was 6.1% (3).
- In December 2022, the Agricultural Production Index had a -0.96% year-on-year variation, with a -2.43% decline in agricultural activity (1)
- The agricultural sector grew by 4.3% by the end of the year compared to the same period in 2021, driven by a 5.5% increase in production in the Agricultural subsector (2)
Policy priority
- Institutional Strategic Plan 2019-2024 (Modified) - MIDAGRI: Implements initiatives to improve agricultural services (5)
- Agricultural Policy Guidelines: A guiding framework for decision-making by public and private sector actors (6)
- Food and Nutritional Security Law No. 31315: Development of public policies on food security (4)
Gender inequalities and marginalization issues
The difference in incomes between men and women can affect consumption patterns in the food and beverage sector. For instance:
The average income of women is 69.6% of men's income - INEI (Sep-2022)(10)- In 2021, men's labor income increased by 10.7%, while it decreased by 1.1% for women(11)
Investment opportunities introduction
- 2021: The country achieved a 13.6% GDP growth (12).
- The National Agricultural Policy (PNA) guides public investment towards providing services that strengthen the sector (14).
- Strategic National Development Plan 2050: proposes to improve rural infrastructure, enhance the productive and commercial capacity of farmers (7).
Key bottlenecks introduction
- Inflation was 6.43% in 2021 and 8.56% in 2022. This reduces the purchasing power of the population (15)(16)
- Agriculture in Peru has low productive efficiency, with 85% of farmers having plots smaller than 10 hectares (17)
- 17% of companies in the extractive sector reported difficulties in finding qualified personnel (18)
Food and Agriculture
Development needs
- Development needs in the agricultural sector persist despite a decade of 3.3% annual growth. Addressing these issues is crucial to enhance its competitiveness in international markets (19).
- The prevalent poverty among most small agricultural producers is, in part, attributed to the improper use and degradation of the natural resource-based production foundation (17).
Policy priority
- National Agrarian Policy: Aims to effectively address quality specifications, certification, innovation, and sustainability issues faced by agricultural producers (14).
- Law No. 31110: Law on the agrarian labor regime and incentives for the agrarian sector, irrigation, agro-export, and agro-industry (20).
Gender inequalities and marginalization issues
- In 2017, 46.9% of rural women earned lower incomes compared to 12.7% of men (22)
- In 2012, 30.8% of individuals engaged in agricultural activities were women, and they controlled only 28.8% of the land allocated to agricultural activities (23)
- Only 6.4% of female agricultural producers managed to secure a loan, while for men, it was 10.4% (23)
Investment opportunities introduction
- Peru is an ideal country for agricultural investment due to its soil conditions and climate diversity (12).
- The National Plan for Product Diversification (PNDP) places significant importance on activities like agriculture (27).
- The Agricultural Fund for Risk Sharing (FAE Agro) aims to guarantee loans for working capital for agricultural producers (13).
Key bottlenecks introduction
- The subdivision of plots into small smallholdings and their widespread dispersion pose a limit to productive efficiency (85% of farmers have plots of less than 10 hectares) (17).
- In 2022, there is a decline in the production of key agricultural products due to a shortage of fertilizers (24).
Agricultural Products
Pipeline Opportunity
Innovation for Agricultural Production Efficiency
Optimize the productive efficiency of rural producers through technological solutions that turn them into digital players, facilitating their connection to opportunities in the digital economy.
Business Case
Market Size and Environment
< USD 50 million
< 5%
From January to September 2022, agricultural production reached USD 512 million, showing a 4.1% increase compared to the same period in 2021 when it was USD 496 million (25).
Peru is suitable for agricultural investment due to the characteristics of its soils, diverse climates, a growing economy, and strong macroeconomic fundamentals (12).
In 2021, agropecultural production was the second-largest employment-generating activity in Peru, thus contributing to greater growth dynamics (26).
Indicative Return
> 25%
Feasibility studies for the implementation of a technology services project for the agricultural sector yield a return on investment ranging from 40% to 50%. (34)
Investment Timeframe
Short Term (0–5 years)
The estimated payback period for an agricultural technology services project is between 3 and 4 years. (34)
Ticket Size
USD 500,000 - USD 1 million
Market Risks & Scale Obstacles
Market Politcal Instability
Market - Volatile
Business - Supply Chain Constraints
Impact Case
Sustainable Development Need
Agricultural activity is characterized by a lack of organization in production and low profitability. Post-harvest and marketing processes suffer from a lack of appropriate road infrastructure and the absence of a wholesale market system, which results in high marketing costs (17).
To consolidate agricultural growth, it is necessary to promote the development of productive factors to address the urgent needs of producers in terms of technological innovation and business management (17).
Agriculture employs 25% of the National Economically Active Population (PEA) and 79% of the Rural Economically Active Population (19). In contrast to its ability to generate employment, it is one of the sectors with lower labor productivity due to the low educational level of the workforce in the rural area.
While the sector grew by 4.3% in 2022 (1), it still remains the least productive economic activity with the highest poverty rate (19).
Gender & Marginalisation
Women make up 43% of the agricultural workforce. However, they are often affected by restrictive sociocultural norms and gender stereotypes in our society, which can limit their ability to make decisions. (28)
Female agricultural producers have an average of 1.8 hectares of agricultural land, whereas male agricultural producers in the same condition have 3 hectares. When it comes to non-agricultural land, men also have a larger area, with 4 hectares, while women have 2.8 hectares. (9)
Expected Development Outcome
The business model aims to increase productivity and efficiency in the agricultural sector, as well as the sustainability necessary for food production.
Gender & Marginalisation
The model provides technology access to farmers, enabling them to enhance their production and improve the sale of their products, thus facilitating better incomes for their families.
Primary SDGs addressed

9.5.1 Research and development expenditure as a proportion of GDP
The agriculture sector employs 26% of the economically active population nationally and 65.5% of the economically active population in rural areas (17).
By 2030, the aim is to improve agricultural sector competitiveness by 36% through vertical integration into the value chain of agricultural producers, reducing the proportion of family agricultural producers at the subsistence level, and enhancing the management of natural resources for sustainable agricultural production.

2.3.2 Average income of small-scale food producers, by sex and indigenous status
On average, female agricultural producers have 1.8 hectares of agricultural land, while male agricultural producers have 3 hectares. In terms of non-agricultural land, men also own a larger area, with 4 hectares, whereas women have 2.8 hectares.
The goal is to increase the purchasing power of agricultural producers.
Secondary SDGs addressed


Directly impacted stakeholders
People
Gender inequality and/or marginalization
Corporates
Public sector
Indirectly impacted stakeholders
People
Gender inequality and/or marginalization
Corporates
Public sector
Outcome Risks
It is increasingly necessary for agricultural businesses to adopt a more entrepreneurial approach. Unifying producers through cooperatives or associations is essential so that they can cover administrative expenses and professionalize their businesses.
Difficulties in accessing agricultural credits: Many farmers have to go through lengthy and bureaucratic processes to access the financial system, whether it's through banks, credit unions, rural savings and loan cooperatives, municipal institutions, etc., to obtain loans.
Impact Risks
The costs incurred for technology investment may not be covered if production levels are not achieved.
The lack of innovation in the agricultural sector could lead to a continued dependence on other sectors to increase its long-term productivity, compromising its sustainability and development.
The lack of access to credit for innovation in the agricultural sector affects the 691,921 women (30.8% of the total people involved in the agricultural sector).
Impact Classification
What
A positive outcome of increased production for high-value crop agricultural producers.
Who
Productivity of agricultural producers increases by using technological tools that allow them to optimize their resources.
Risk
Limited access to new technologies would hinder the use of the necessary tools.
Impact Thesis
Providing technological and innovative solutions to rural producers to enhance their production efficiency
Enabling Environment
Policy Environment
National Development Strategic Plan 2050 makes reference to agricultural production and fertilizers within the framework of a broader vision for the sustainable development of the country (7).
The "Reactiva Perú" program's objective is to provide a quick and effective response to the liquidity needs that companies face due to the impact of COVID-19 (8).
Financial Environment
Financial incentives: The budget for the agricultural sector in 2022 amounted to US$1.638 million. The government has indicated that one of the priorities for economic recovery is the agricultural sector, with a focus on promoting the development of irrigation infrastructure and supporting producers.
Fiscal incentives: The agricultural sector enjoys tax benefits that allow it to have lower income tax rates and advance payments. Additionally, they can deduct up to 10% of their expenses on purchases of goods and services made to taxpayers who are part of the new RUS (Simplified Tax Regime).
Regulatory Environment
Law No. 31110. Law on the agrarian labor regime and incentives for the agricultural, irrigation, agro-export, and agro-industrial sector (20)
National Decent Employment Policy (PED) Supreme Decree No. 013-2021-TR ensures conditions for the fulfillment of labor rights and fair income. (21)
Marketplace Participants
Private Sector
SPACE AG, Dinsac Group, Bio Natural Solutions, Pachatec
Government
Ministry of Agricultural Development and Irrigation (MIDAGRI), Ministry of Labor and Employment Promotion (MTPE), Ministry of the Environment (MINAM).
Multilaterals
ProInnovate, FONDECYT, Indecopi
Public-Private Partnership
UTEC Ventures, BioIncuba
Target Locations
Macroregion Norte
Macroregion Sur
Region Lima y Callao
References
- (1) INEI (2023). Informe técnico de producción nacional diciembre 2022.
- (2) MIDAGRI (2022). Informe del Valor Bruto de la Producción Agropecuaria.
- (3) BCRP (2023). Notas de estudios diciembre 2022
- (4) Congreso de la República (2021), Ley N° 31315 - Ley de seguridad alimentaria y nutriciona
- (5) MIDAGRI (2022), Plan Estratégico Institucional 2019-2024 (Modificado)
- (6) MIDAGRI (2015), Lineamiento de política agraria
- (7) PCM (2022), Plan Estratégido de Desarrollo Nacional al 2050
- (8) MEF (2023). Programa Reactiva Perú (Modificado)
- (9) INEI (2022). Perú Brechas de Género 2022
- (10) INEI (2022). Estadísticas con Enfoque de Género
- (11) GOB.PE (2022). Brecha de ocupación laboral - Nota de Prensa
- (12) EY (2022). Guía de Negocios e Inversión en Agricultura y Agribusiness en el Perú 2022/2023
- (13) GOB.PE (2020). Gobierno crea el FAE-AGRO para inyectar S/ 2,000 millones en créditos a pequeños productores - Nota de prensa
- (14) MIDAGRI (2021), D. S. N° 017-2021-MIDAGRI, Política Nacional Agraria 2021-2030
- (15) BCRP (2022). Reporte de Inflación . Diciembre 2022
- (16) INEI (2023). Variación de los Indicadores de precios de la Economía. Diciembre 2022
- (17) MIDAGRI (2022). Problemas tipo de la agricultura peruana
- (18) MTPE (2022). Encuesta de Demanda Ocupacional (EDO)
- (19) Fundación Friedrich Ebert (2021). La Agricultura Peruana Situación Post COVID-19
- (20) Congreso de la República (2020), Ley N° 31110. Ley del régimen laboral agrario
- (21) MTPE (2021), Politíca Nacional de Empleo Decente
- (22) Observatorio Nacional de la Violencia Contra las Mujeres y los Integrantes del Grupo Familiar (2019). Mujeres rurales en el Perú: población vulnerable a la violencia
- (23) INEI (2012). Inequidad de género en la actividad agropecuaria
- (24) Conveagro (2022). Perú afronta una preocupante escasez de fertilizantes a las puertas de la próxima campaña agrícola
- (25) MIDAGRI (2022). El Agro en cifras. Mes: Abril 2022
- (26) BCRP (2021). Actividad Productiva y Empleo. Memoria 2021
- (27) PRODUCE (2022) Programa Nacional de Diversificación Productiva
- (28) FAO (2022). The state of food security and nutrition in the world
- (29) Banco mundial (2023). Alimentos y agricultura. Panorama general
- (30) GIZ (2018) Agricultural insurance policies for farmers in Peru
- (31) MIDAGRI (2022). Programa Multianual de Inversiones 2022-2024
- (32) INEI (2022). Población peruana alcanzó los 33 millones 396 mil personas el año 2022 - Nota de prensa
- (33) PUCP (2019).
- (34) Congreso de la República (2021). Ley N° 31339. Ley que promueve la industrialización del agro
- (35) FIDA (2019). Project for the Improved Commercialization of Agricultural Products
- (36) SPACE AG
- (37) DINSAC GROUP
- (38) BIONATURAL SOLUTIONS
- (39) PACHATEC
- (40) MINCETUR (2022). Reporte de comercio regional
- (41) El Peruano (2020): Innovación para mejorar la chacra

