Off-grid and mini-grid solar solutions
Business Model Description
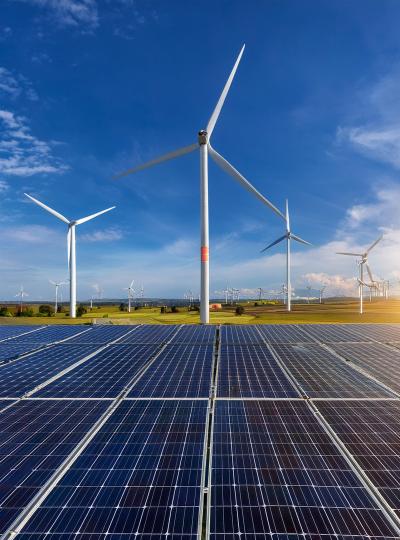
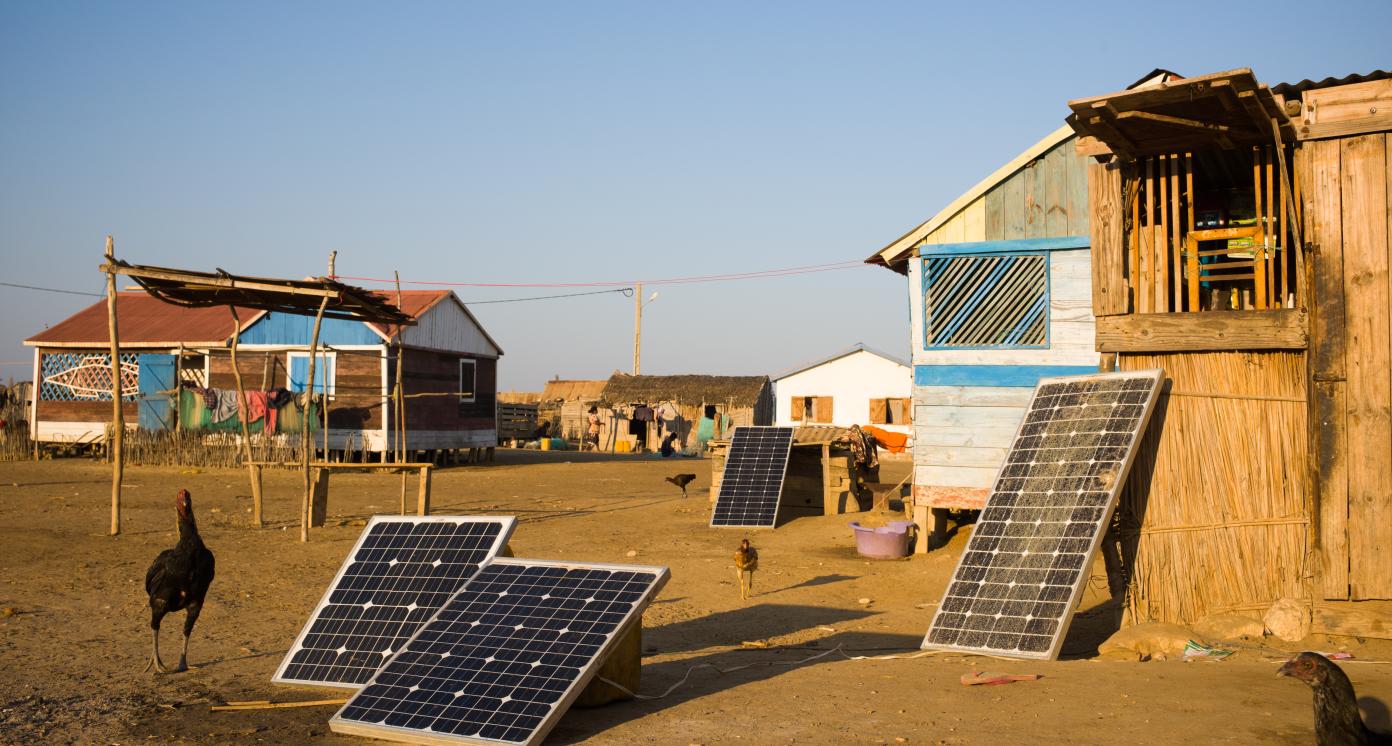
Provide off-grid and mini-grid solar solutions through lease-to-own model or direct sale of electricity to customers.
Expected Impact
Enable access to electricity at lower costs for rural communities..
How is this information gathered?
Investment opportunities with potential to contribute to sustainable development are based on country-level SDG Investor Maps.
Disclaimer
UNDP, the Private Finance for the SDGs, and their affiliates (collectively “UNDP”) do not seek or solicit investment for programmes, projects, or opportunities described on this site (collectively “Programmes”) or any other Programmes, and nothing on this page should constitute a solicitation for investment. The actors listed on this site are not partners of UNDP, and their inclusion should not be construed as an endorsement or recommendation by UNDP for any relationship or investment.
The descriptions on this page are provided for informational purposes only. Only companies and enterprises that appear under the case study tab have been validated and vetted through UNDP programmes such as the Growth Stage Impact Ventures (GSIV), Business Call to Action (BCtA), or through other UN agencies. Even then, under no circumstances should their appearance on this website be construed as an endorsement for any relationship or investment. UNDP assumes no liability for investment losses directly or indirectly resulting from recommendations made, implied, or inferred by its research. Likewise, UNDP assumes no claim to investment gains directly or indirectly resulting from trading profits, investment management, or advisory fees obtained by following investment recommendations made, implied, or inferred by its research.
Investment involves risk, and all investments should be made with the supervision of a professional investment manager or advisor. The materials on the website are not an offer to sell or a solicitation of an offer to buy any investment, security, or commodity, nor shall any security be offered or sold to any person, in any jurisdiction in which such offer would be unlawful under the securities laws of such jurisdiction.
Country & Regions
- Rwanda: Eastern Province
- Rwanda: Southern Province
- Rwanda: Northern Province
- Rwanda: Western Province
Sector Classification
Renewable Resources and Alternative Energy
Development need
Current energy capacity in Rwanda equals 218 MW (megawatts), with 45% coming from hydropower, 27% from diesel and heavy fuel oil combustion, 14% from methane combustion, 7% from peat burning and 6% from solar radiation. Estimated demand of 282 - 376 MW in 2024 relies strongly on hydropower which is susceptible to seasonal changes and can contribute to disruptions in supply.(1)
Policy priority
The National Strategy for Transformation (NST 1) aims to upscale affordable and reliable good quality electricity generation and provision. The industry, market centers and socio-economic facilities are the major recipients in need of sufficient and stable energy supplies.(2) Under the United Nations Development Programme's (UNDP’s) 'Sustainable Energy for All' programme, Rwanda aims for 52% of its electricity to come from renewable resources by 2030.(1)
Gender inequalities and marginalization issues
Only 35% of population have access to electricity, which is a major constraint for livelihood, production and growth.(3) Limited access disproportionately affects women, given the higher labor and time burden on women to access energy.
Investment opportunities introduction
An estimated 52% of Rwanda's electricity will be sourced from the main grid, whereas 48% will be generated by the off-grid infrastructure when all population has an access to electricity.(1) Demand for electricity is growing (8% per year). Current insufficient supply creates a gap that can be bridged by private investments.(1)
Key bottlenecks introduction
Rwanda is significantly below the targets for SDG 7 - Affordable and Clean Energy. The main challenges relate to electricity access, and low availability of clean fuel and cooking technology.(3)
Alternative Energy
Policy priority
The government plans to provide 100% of Rwandan population with access to electricity by 2024.(1)
Gender inequalities and marginalization issues
Current data shows current demand for scaling grid connections may not be economically viable at the moment. However, as demand grows, off-grid and mini-grid solutions can supply electricity for Rwanda's poorest community members.(1)
Investment opportunities introduction
Off-grid solutions are planned to source 48% of Rwanda's total energy by 2024. In 2018 they accounted for 11% of generated electricity.(1) These figures suggest around 1.4 million households will be in the market for off-grid solutions by 2024.(5)
Key bottlenecks introduction
High prices of solar panels were a significant obstacle in the past. Production costs are falling (6), but logistics issues with panel provision may still occur (7). Demand for electricity was low, and so did not attract investor. However, demand is gradually increasing.(1)
Solar Technology and Project Developers
Pipeline Opportunity
Off-grid and mini-grid solar solutions
Provide off-grid and mini-grid solar solutions through lease-to-own model or direct sale of electricity to customers.
Business Case
Market Size and Environment
< USD 50 million
In 2018, the total investment in solar off-grid sector amounted to USD 11.58 million.(8)
Off-grid solutions are planned to source 48% of Rwanda's total energy by 2024. In 2018 they accounted for 11% of generated electricity.(1) These figures suggest around 1.4 million households will be in the market for off-grid solutions by 2024.(5)
Indicative Return
15% - 20%
Based on regional examples, mini-grid projects can achieve return rates of up to 15% - 20%.(9)
The benchmark return on equity is 15.6% to 19.6%, based on cost of equity data for the subsector including a country risk premium.(11)
Investment Timeframe
Medium Term (5–10 years)
Constructing solar mini-grid take 3 - 6 months, while solar home system panel investments take less than 3 months.(10)
The investment timeframe depends on the quantity and size of the solutions deployed. The investment timeframe may take from 5 to 15 years, based on benchmark sectoral statistics.(11)
Ticket Size
< USD 500,000
Market Risks & Scale Obstacles
Capital - CapEx Intensive
Business - Supply Chain Constraints
Business - Supply Chain Constraints
Impact Case
Sustainable Development Need
In Rwanda, 65% of population has no access to grid electricity, with rural areas having the lowest rate of electricity penetration.(4)
Gender & Marginalisation
Only 35% of population have access to electricity, which is a major constraint for livelihood, production and growth.(3) Limited access disproportionately affects women, given the higher labor and time burden on women to access energy.
Expected Development Outcome
Improved access to electricity for households with lower electricity costs and reduced electricity outages
Contribution to emission reduction
Increased access to energy consuming house appliances and new opportunities for information and communications technology (ICT) development
Gender & Marginalisation
Promoting renewable and clean sources of energy can help reduce air pollution, particularly in rural areas where fossil fuels are used for energy and heating. Clean energy sources can particularly help women who are preoccupied with unpaid domestic work.
Primary SDGs addressed

7.1.1 Proportion of population with access to electricity
7.2.1 Renewable energy share in the total final energy consumption
46.7% (23)
53% (Proxy: Renewable energy share in total final electricity generation) (23)
100% (24)
60% (25)

13.3.2 Number of countries that have communicated the strengthening of institutional, systemic and individual capacity-building to implement adaptation, mitigation and technology transfer, and development actions.
N/A
N/A
Secondary SDGs addressed


Directly impacted stakeholders
People
Planet
Corporates
Indirectly impacted stakeholders
Public sector
Outcome Risks
Producing photovoltaic (PV) devices may involve a variety of chemicals and materials (trichloroethane, acetone, ammonia, isopropyl alcohol and methanol).(14)
Risk of chemicals used in PV cells being released to air, surface water or groundwater at the manufacturing facility, the installation site, and the disposal or recycling facility.(15)
Depending on their location, larger utility-scale solar facilities can raise concerns about land degradation and habitat loss.(16)
Impact Classification
What
The outcome is likely to be positive because it will increase access to electricity at a lower cost and more quickly than grid connections.
Who
Remote rural communities, companies and public buildings that have limited access to electricity, which also limits their activities
Risk
Although the model is market proven, current electricity consumption and the affordability of solutions can limit access to the poorest households and constrain the market.
Impact Thesis
Enable access to electricity at lower costs for rural communities..
Enabling Environment
Policy Environment
Rural Electrification Strategy: This strategy sets programmes to enable low income households to access basic solar systems, mitigate private sector risks, establish affordable financial terms and provide information about sustainable sites for investment in solar systems.(1)
7 Years Government Programme - National Strategy for Transformation (NST 1): By cooperating with the private sector and deploying on-grid and off-grid solutions, the government wants to increase access to electricity to 100% in 2024 (from 34.5% in 2017).(2)
Energy Sector Strategic Plan: The highest focus is on the poorest members of society, so the government introduced progressive tariffs for electricity in 2017 (the more one consumes the higher the tariff). It will contribute to increasing demand of poorer households.(1)
Off-Grid Solar Market Assessment: The government is aware of the pricing constraints, and is planning to introduce a results-based financing subsidy program. The size of the subsidy will depend on income. This will allow every income group to afford a solar home system.(5)
Financial Environment
Financial incentives: The World Bank Group facilitates a program 'Rwanda - Energy Access and Quality Improvement Project' with total investment of USD 288 million between 2020-2026, which may be a potential source of capital. (18)
Fiscal incentives: Tax exemption including value added tax on imported equipment, investment allowance up to 50%, free repatriation of profits,100% write off for R&D costs, preferential corporate income tax (CIT) of 15%, CIT holiday of up to 7 years for energy projects producing 25 MW with USD 50 million in investment (19),(20)
Other incentives: Provision of investment certificates for investors receiving special treatment and provision of Rwanda Development Board (RDB) aftercare support to registered projects with investment certificates.(19),(20)
Regulatory Environment
Rwanda has a well organized regulatory structure: the National Energy Policy 2015 establishes long term framework with strategic goals, while the Energy Sector Strategic Plan 2018/19 - 2023/24 outlines targets and their implementation strategy.(1)
Energy Sector Strategic Plan: Rwanda also has a strong focus on renewable energy. In particular, the 'Sustainable Energy for All Action Agenda' and the 'Scaling up Renewable Energy Program Investment Plan' present plans to implement solar off-grid solutions with the support of international organizations such as World Bank.(1)
The Rwanda Utility Regulatory Authority licenses off-grid and mini-grid renewables for projects up to 5 MW (megawatts).The license for full mini-grid gives the exclusive right for transport and retail of energy for 5-25 years in a specific area, although generation remains open to competition.(17)
Ministerial Guidelines on Minimum Standard Requirements for Solar Home Systems: These guidelines were introduced in 2018 to maintain high quality solar systems.(8)
Energy Sector Strategic Plan: Rwanda introduced the Rural Electrification Strategy (RES) and the National Electrification Plan (NEP), which present specific program for delivering off-grid solution focusing on rural areas.(1)
Marketplace Participants
Private Sector
Mobisol, Ignite Power, Bboxx Capital, Mesh Power, Absolute Energy, Neseltec, One Acre Fund, d.light
Government
Renewable Energy Fund, Energy Division of Ministry of Infrastructure, Rwanda Development Board (RDB)
Multilaterals
KawiSafi Ventures, Acumen Fund, World Bank (WB), European Investment Bank (EIB), African Development Bank (AfDB)
Non-Profit
USAID Women in Rwandan Energy (WIRE)
Target Locations
Rwanda: Eastern Province
Rwanda: Southern Province
Rwanda: Northern Province
Rwanda: Western Province
References
- (1) Ministry of Infrastructure (2017). Draft Energy Sector Strategic Plan 2018/19 - 2023/24. Republic of Rwanda.
- (2) Republic of Rwanda (2017). 7 Years Government Programme: National Strategy for Transformation (NST 1) 2017 – 2024 Final.
- (3) Sachs, J., Schmidt-Traub, G., Kroll, C., Lafortune, G., Fuller, G., Woelm, F. (2020). The Sustainable Development Goals and COVID-19. Sustainable Development Report 2020. Cambridge: Cambridge University Press.
- (4) World Bank database. https://data.worldbank.org/
- (5) Power Africa Off-grid Project (2019). Off-Grid Solar Market Assessment - Rwanda.
- (6) Abrams, C. (2016). Rwanda – A Case Study in Solar Energy Investment. https://www.jstor.org/stable/26256477?seq=1
- (7) African Development Bank (2013). Rwanda Transport Sector Review and Action Plan. https://www.afdb.org/fileadmin/uploads/afdb/Documents/Project-and-Operations/Rwanda_-_Transport_Sector_Review_and_Action_Plan.pdf
- (8) Energy Private Developers (2019). Rwanda Off-grid sector status report 2018. https://www.urwegobank.com/wp-content/uploads/2019/09/EnDev_Off-Grid-Sector-Status-Report_2018.pdf
- (9) Nigerian Economic Summit Group (2018). Minigrids Investment Report: Scaling The Nigerian Market 2018.
- (10) German Energy Solutions (2018). Presentation on Nigeria's off-grid renewable energy market and investment potentials. https://www.german-energy-solutions.de/GES/Redaktion/DE/Publikationen/Praesentationen/2018/181120-iv-nigeria-ohiahre-rea.pdf?__blob=publicationFile&v=3
- (11) PwC analysis based on Prof. A. Damodaran data, 2020.
- (12) Intermountain Wind and Solar. Off-Grid Solar Energy Systems — Pros and Cons. https://www.intermtnwindandsolar.com/off-grid-solar-energy-systems-pros-and-cons/
- (13) Ministry of Infrastructure (2014). Sustainable Energy for All Rapid Assessment and Gap Analysis. https://www.se4all-africa.org/fileadmin/uploads/se4all/Documents/Country_RAGAs/Rwanda_RAGA_EN_Released.pdf
- (14) Gündoğan, B. and Koçar, G. (2019). An Overview On The Environmental Impacts Of Photovoltaic Panel Production. Conference Paper. https://www.researchgate.net/publication/330683286_AN_OVERVIEW_ON_THE_ENVIRONMENTAL_IMPACTS_OF_PHOTOVOLTAIC_PANEL_PRODUCTION
- (15) Klugmann-Radziemska, E. (2011). Environmental Impact of Photovoltaic Technologies. Low Carbon Earth Summit, 19-26 October 2011.
- (16) Sani, G., Sahabi, S. and Ibrahim, A. (2019). 'Renewable Energy: Environmental Impacts And Economic Benefits For Sustainable Development', International Journal of Engineering and Technical Research, V8(08). https://www.researchgate.net/publication/335653305_Renewable_Energy_Environmental_Impacts_and_Economic_Benefits_for_Sustainable_Development
- (17) Bloomberg New Energy Finance (2016). Rwanda Simplified Licensing Procedure for Off-grid Renewable Energy Projects - Policy Overview. http://energyaccess.org/wp-content/uploads/2016/06/Rwanda-simplified-licensing-procedure-for-off-grid-renewable-energy-projects-_-Bloomberg-New-Energy-Finance.pdf
- (18) World Bank (2020). Rwanda - Energy Access and Quality Improvement Project. https://www.worldbank.org/en/news/loans-credits/2020/09/17/rwanda-energy-access-and-quality-improvement-project
- (19) Rwanda Development Board. Investment Opportunities. https://rdb.rw/investment-opportunities/energy/#tab-1-3
- (20) Rwanda Development Board (2015). The Law on Investment Promotion and Facilitation.
- (21) National Institute of Statistics in Rwanda (2019). Rwanda Statistical Yearbook 2019.
- (22) Energy Private Developers (2020). Rwanda Energy Sector Annual Report 2019. https://www.epdrwanda.com/wp-content/uploads/2020/05/2019-ENERGY-SECTOR-REPORT.pdf
- (23) Republic of Rwanda (2019). Voluntary National Review Rwanda 2019. https://sustainabledevelopment.un.org/content/documents/23432Rwanda_VNR_Document__Final.pdf
- (24) Sachs, J., Schmidt-Traub, G., Kroll, C., Lafortune, G., Fuller, G., Woelm, F. (2020). The Sustainable Development Goals and COVID-19. Sustainable Development Report 2020. Cambridge: Cambridge University Press. https://dashboards.sdgindex.org/profiles/RWA
- (25) Sustainable Energy for All. Rwanda. https://www.se4all-africa.org/seforall-in-africa/country-data/rwanda/
- (26) Azuri (2021). Rwanda's first PayGo solar power heads towards success. https://www.azuri-group.com/rwandas-first-paygo-solar-power-heads-towards-success/

