


Fruit processing
Fruit processing
Business Model Description
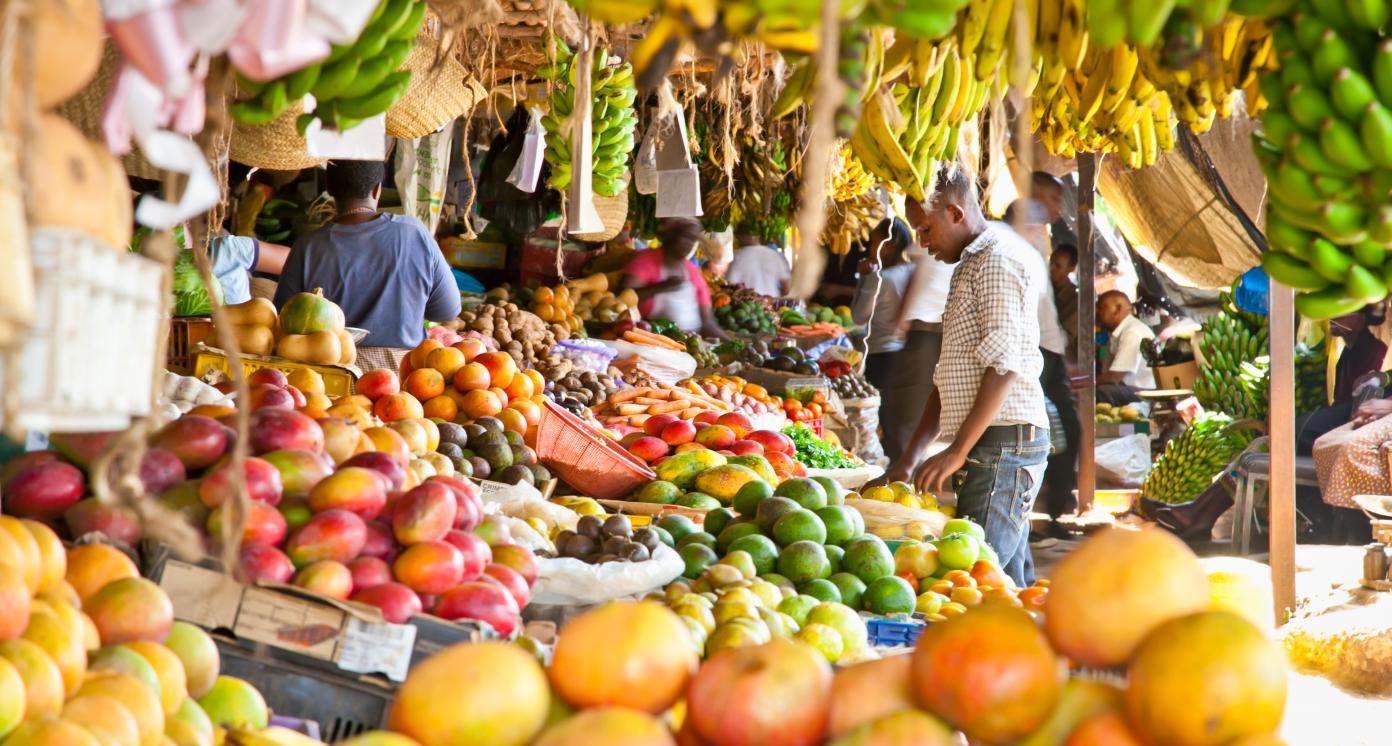
Process fruits, such as mangos, pineapples, bananas and coconuts and pursue value adding activities such as drying, packing, puree making, marketing and juice making.
Expected Impact
Increase income of smallholder farmers through increased national value added, and decrease post-harvest losses.
How is this information gathered?
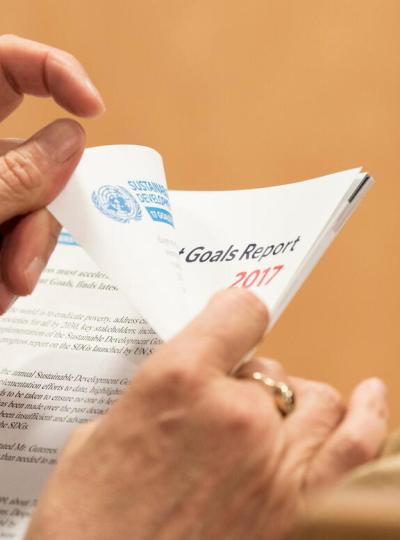
Investment opportunities with potential to contribute to sustainable development are based on country-level SDG Investor Maps.
Disclaimer
UNDP, the Private Finance for the SDGs, and their affiliates (collectively “UNDP”) do not seek or solicit investment for programmes, projects, or opportunities described on this site (collectively “Programmes”) or any other Programmes, and nothing on this page should constitute a solicitation for investment. The actors listed on this site are not partners of UNDP, and their inclusion should not be construed as an endorsement or recommendation by UNDP for any relationship or investment.
The descriptions on this page are provided for informational purposes only. Only companies and enterprises that appear under the case study tab have been validated and vetted through UNDP programmes such as the Growth Stage Impact Ventures (GSIV), Business Call to Action (BCtA), or through other UN agencies. Even then, under no circumstances should their appearance on this website be construed as an endorsement for any relationship or investment. UNDP assumes no liability for investment losses directly or indirectly resulting from recommendations made, implied, or inferred by its research. Likewise, UNDP assumes no claim to investment gains directly or indirectly resulting from trading profits, investment management, or advisory fees obtained by following investment recommendations made, implied, or inferred by its research.
Investment involves risk, and all investments should be made with the supervision of a professional investment manager or advisor. The materials on the website are not an offer to sell or a solicitation of an offer to buy any investment, security, or commodity, nor shall any security be offered or sold to any person, in any jurisdiction in which such offer would be unlawful under the securities laws of such jurisdiction.
Country & Regions
- Kenya: Coast
- Kenya: Eastern
- Kenya: Nyanza
- Kenya: Western
Sector Classification
Food and Beverage
Development need
According to the Sustainable Development Report, SDG 2 - Zero Hunger is a major challenge in Kenya and the overall score for this goal is stagnating. The COVID-19 crisis contributes to price fluctuations, food insecurity and supply chains disruptions. Food inflation in Kenya reached 10.6% in March 2020, compared with 2.8% in the same month in the previous year.(1)
Policy priority
Policy documents and initiatives such as the Third Medium Term Plan, the Kenyan Vision 2030 and the Agricultural Sector Growth and Transformation Strategy highlight the potential of agriculture for national development. Achieving food security is among Kenya's top four policy priorities according to its 'Big Four Agenda'.
Gender inequalities and marginalization issues
Women constitute almost 80% of agricultural workers in Kenya. Yet, they often do not have any ownership of farming lands or production equipment. They also suffer from an unequal access to relevant agricultural loans.(33)
Investment opportunities introduction
Accounting for 34% of Kenyan gross domestic product (GDP)(2), agriculture is the main employer of the Kenyan population. Total sales in agriculture reached USD 26.5 billion in 2019 and are expected to grow at an average rate of 1.52% in 2020-2025.(3)
Key bottlenecks
Some critical bottlenecks include poor education and management skills among farmers, business atomization, supply chain deficiencies, limited access to capital and inputs, lack of storage and poor handling practices, low access to information and ICT (information and communications technology) services, as well as the aging farming population.
Food and Agriculture
Development need
Kenyan households that are engaged in the agriculture sector contribute 31.4% to the reduction of rural poverty. Agriculture is the largest income source for both poor and non-poor households in rural areas.(4) However, major challenges remain for Kenya's SDG 2 performance, particularly in undernourishment, stunting, cereal yield and nitrogen management.(5)
Investment opportunities introduction
The government aims to provide access to land, security, power and water supply to attract private sector investors in agriculture.(6) Several priority programs were established to revitalize agriculture in Kenya such as the Agricultural Development Program along the LAPSSET (Lamu Port, South Sudan, Ethiopia) corridor, Agri-Business Development Program, and the Revitalising of the Coconut Industry Program.(7)
Processed Foods
Pipeline Opportunity
Fruit processing
Process fruits, such as mangos, pineapples, bananas and coconuts and pursue value adding activities such as drying, packing, puree making, marketing and juice making.
Business Case
Market Size and Environment
< USD 50 million
10% - 15%
In 2019, Kenya's processed fruits and vegetables industry recorded 12% retail current value growth, reaching USD 22 million (KES 2.4 billion). In the same period, volume grew to10,100 tons.(10)
According to the International Trade Center in Kenya, the fruit sector grew by 12% per year between 2005 and 2015, driven by increasing demand for healthy drinks and fresh fruits. However, around 40% of fruit crops end as food losses, and only 8% of fruit is being processed.(33) This demonstrates an important potential for further sector development.
Fruits with high processing potential are mangoes and pineapples. Kenyan mango production fluctuates around 800,000 metric tons (MT) (775,000 MT in 2018) and pineapples reached 350,000 MT in 2018.(11)
Indicative Return
> 25%
A case study on Kenyan investments tackling post-harvest loss reduction estimate an internal rate of return (IRR) of 28% in 10 years.(12)
The Best Tropical Fruits is expecting investment in fruit processing will generate an IRR around126% (13) In a neighboring country, Mujaasi Investments (which is aggregating, processing and marketing various foods, including fruits) has a projected IRR of 233% over 5 years.(13)
A small-scale mango chip processor in Ghana achieved an IRR of 77%.(14) Another case study from Ethiopia characterizes investments in post-harvest technologies as having a high return - ex-ante analysis of investments to reduce post-harvest maize losses estimated an IRR of 250%.(12)
Investment Timeframe
Medium Term (5–10 years)
Investments in food processing have an expected repayment period of 5 to 10 years.(13) (12)
Goshen Farm Exporters offers a 6-year investment opportunity in scaling their fruit processing.(13)
Different active stakeholders in the sector estimated the timeframe to be 7 years.(15)
Ticket Size
USD 500,000 - USD 1 million
Market Risks & Scale Obstacles
Business - Supply Chain Constraints
Capital - CapEx Intensive
Business - Supply Chain Constraints
Impact Case
Sustainable Development Need
Although the agriculture sector contributes around 34% to national gross domestic product (GDP) and employs over half of the population,(2) the agro-processing industry constitutes only 3.2% of additional GDP growth and generates just 2.4% employment in the sector. This is well below the potential value added. (17)
Only 16% of agricultural export was processed, compared with 57% of imports that are processed.(11)
Fruits and vegetables experience the highest post-harvest losses - up to 50%, although average losses range between 20% and 35% (25% - 44% for mangos). One of the reasons for this is the lack of agro-processing.(18)
Gender & Marginalisation
Women constitute almost 80% of agricultural workers in Kenya. Yet, they often do not have any ownership of farming lands or production equipment. They also suffer from an unequal access to relevant agricultural loans.(33)
Expected Development Outcome
Increased export value and agricultural value added, increased incomes for farmers
Reduced post-harvest loss and food waste
Extended shelf life of food products and improved nutrition conditions
Gender & Marginalisation
Increased employment opportunities especially for youth and females due to the development of the agricultural sector
Primary SDGs addressed
2.3.2 Average income of small-scale food producers, by sex and indigenous status
2.c.1 Indicator of food price anomalies
N/A
Domestic food price anomaly index score: 6.00 (34)
N/A
N/A
8.2.1 Annual growth rate of real GDP per employed person
8.5.1 Average hourly earnings of employees, by sex, age, occupation and persons with disabilities
2.4% in 2018 (34)
N/A
N/A
N/A
12.3.1 (a) Food loss index and (b) food waste index
N/A
N/A
Secondary SDGs addressed
Directly impacted stakeholders
People
Gender inequality and/or marginalization
Planet
Indirectly impacted stakeholders
People
Corporates
Outcome Risks
Loss of land due to removing vegetal cover during site preparation and construction (soil sealing). Displacement of agricultural production and negative effect on sedentary farmers.(19)
Loss of nutrients (e.g. vitamin C and phenolics in fruits are susceptible to loss during processing, especially by leaching from plant tissues into processing water) (20)
Water and/or noise pollution (19)
Gender inequality and/or marginalization risk: Any negative environmental outcome will predominantly impact the main source of income for women and rural households; that is, farming lands.
Impact Risks
Gender inequality and/or marginalization risk: Stakeholder participation risk - Because women account for the majority of the farming workforce, their expectations need to be considered.
Impact Classification
What
Investing in fruits processing is likely to have a positive outcome because it increases value added, farmers' income and exports, and reduces post-harvest loss.
Who
Smallholder farmers, fruits producers, growers and exporters whose incomes are lower due to the lack of processed fruits, as well as society in general.
Risk
Although the model is market proven, uninterrupted functioning requires a well-established supply chain and contacts with farmers to pay back high capital expenditure associated with processing facilities.
Impact Thesis
Increase income of smallholder farmers through increased national value added, and decrease post-harvest losses.
Enabling Environment
Policy Environment
Third Medium Term Plan of 2018-2022: Under this plan, the government aims to increase manufacturing from 9.2% of gross domestic product (GDP) in 2017 to 15% by 2022, and increase agro-processing to at least 50% of total agricultural production.(21)
Manufacturing Priority Agenda: This document presents the Kenya Association of Manufacturer's position on how to develop manufacturing in line with government objectives. The joint goal is to increase competitiveness and remove existing challenges in manufacturing.(22)
Agriculture Sector Transformation and Growth Strategy: The first goal this strategy is to increase farmers' income. The second is to raise agricultural value added by USD 1.2 billion over 5 years.(23)
Financial Environment
Fiscal incentives: Depending on the project, Export Processing Zones (EPZs) offer incentives such as: a 10-year corporate income tax holiday and a 25% tax rate for 10 more years; perpetual exemption from value added tax (VAT) and customs duty for inputs; exemption from stamp duty fees; and 100% investment deductions in EPZ building and machinery investments for 20 years.(24)
Other incentives: A 2.5% capital deduction is offered for industrial buildings for the first 40 years of operation.(24) There is a 100% investment deduction for capital expenditures on manufacturing buildings/machinery; this increases to 150% for investment over USD 2 million outside Nairobi.(24) (25) Wear and tear deductions of 37.5% are also available for heavy machinery, tractors etc.
Regulatory Environment
Food Crops Industry Bill 2020: This Bill regulates the development and promotion of the food crops industry (including growers registration, taxation and licensing) and establishes the Food Crops Regulatory Authority.(24)
Coffee Bill 2020: This Bill regulates licensing and growers registration, and establishes production, processing, trading and marketing related regulations. It also establishes a Coffee Board, a Coffee Council and the Coffee Research Institute.(25)
Nuts and Oil Crops Bill 2020: This Bill regulates licensing and growers registration, and establishes production, processing, trading and marketing related regulations. It also establishes the Nuts and Oil Crops Board, and the Nuts and Oil Crops Council.(26)
Horticultural Crops Authority Bill 2020: This Bill regulates licensing and growers registration, and establishes production, processing, marketing and promotion related regulations. It also establishes the Horticultural Crops Authority.(27)
Marketplace Participants
Private Sector
Fresh Green Growers (K) Limited, Kenya Green Harvesters, Food Industries Ltd, Avenue Fresh EPZ Ltd, Kazam Fresh (Amin & Aziz Partners Ltd), Kevian, Sunny Processors Limited, Azuri Health, Best Tropical Fruits, All Fruits, Milly Fruits, American Garden Products Inc, Aryuv Agencies Ltd, Exotic Foods Co Ltd, Njoro Canning Factory Ltd, Rhodes Food Group
Multilaterals
World Bank, Government of Sweden, Global Agriculture and Food Security Program
Non-Profit
Fresh Produce Exporters Association of Kenya (FPEAK), Kenya Plant Health Inspectorate Service (KEPHIS), National Horticultural Research Centre in Thika District, Horticultural Crops Development Authority (HCDA), Agricultural Finance Corporation, The Rockefeller Foundation
Target Locations

Kenya: Coast
Kenya: Eastern
Kenya: Nyanza
Kenya: Western
References
- (1) World Bank (2020). Kenya Economic Update: Turbulent Times for Growth in Kenya.
- (2) World Bank database, 2020. https://data.worldbank.org/
- (3) ISIC Classification Revision. Comparative Industry Forecast Tables - Agriculture.
- (4) World Bank (2019). Unbundling the Slack in Private Sector Investment: Transforming Agriculture Sector Productivity and Linkages to Poverty Reduction. April 2019 | Edition No. 19.
- (5) Sachs, J., Schmidt-Traub, G., Kroll, C., Lafortune, G., Fuller, G., Woelm, F. (2020). The Sustainable Development Goals and COVID-19. Sustainable Development Report 2020. Cambridge: Cambridge University Press.
- (6) Ministry of Agriculture (2019). Agricultural Sector Transformation and Growth Strategy: Towards Sustainable Agricultural Transformation and Food Security in Kenya 2019-2029.
- (7) Government of Kenya. National Agriculture Investment Plan (NAIP) 2019-2024. http://extwprlegs1.fao.org/docs/pdf/ken189052.pdf
- (8) World Bank (2020). Kenya Economic Update: Turbulent Times for Growth in Kenya,
- (9) Food and Agriculture Organization of the United Nations. Agriculture Policies Database for Kenya.
- (10) Euromonitor International (2019). Sector capsule: Processed fruit and vegetables in Kenya.
- (11) Food and Agriculture Organization of the United Nations. FAOStat. http://www.fao.org/faostat/en/#data/QC
- (12) Mujuka, E., Mburu, J., Ogutu, A. and Ambuko, J. (2017). 'Returns to investment in post-harvest loss reduction technologies among mango farmers in Embu County, Kenya', Food and Energy Security. https://onlinelibrary.wiley.com/doi/full/10.1002/fes3.195
- (13) Alliance for a Green Revolution in Africa (2019). The Agribusiness Deal Room at the 2019 African Green Revolution Forum (AGRF). https://agrf.org/dealroom/wp-content/uploads/2020/07/Agribusiness-Deal_Room-AGRF-booklet_020919.pdf
- (14) Comtrade database. https://comtrade.un.org/data/
- (15) UNDP/PwC stakeholder interviews, 2020.
- (16) Mercer, D. (2011). 'Challenges Facing Development Within the Agri-Food Sector of Sub-Saharan Africa', Procedia Food Science, 1, 1861-1866. https://www.sciencedirect.com/science/article/pii/S2211601X11002744
- (17) World Bank (2019). Country Private Sector Diagnostic - Creating Markets In Kenya: Unleashing Private Sector Dynamism to Achieve Full Potential.
- (18) International Food Policy Research Institute (2018). Post-Harvest Losses in Fruits and Vegetables: The Kenyan Context. http://ebrary.ifpri.org/utils/getfile/collection/p15738coll2/id/132325/filename/132536.pdf
- (19) Chukwu, O. (2009). 'Impacts of Food Processing Industry on some Environmental Health and Safety Factors', Caspian Journal of Environmental Sciences, 7. https://cjes.guilan.ac.ir/article_1015.html
- (20) Kalt, W. (2006). Effects of Production and Processing Factors on Major Fruit and Vegetable Antioxidants. Institute of Food Technologies. https://onlinelibrary.wiley.com/doi/abs/10.1111/j.1365-2621.2005.tb09053.x
- (21) Republic of Kenya (2018). Third Medium Term Plan 2018 – 2022 Transforming Lives: Advancing Socio-economic Development Through The 'Big Four'.
- (22) Kenya Association of Manufacturers (2019). Manufacturing priority agenda 2019. https://kam.co.ke/kam/wp-content/uploads/2019/02/KAM-Priority-Agenda-2019.pdf
- (23) Ministry of Agriculture (2019). Agricultural Sector Transformation and Growth Strategy: Towards Sustainable Agricultural Transformation and Food Security in Kenya 2019-2029.
- (24) KENIvest. Investment Incentives. http://www.invest.go.ke/starting-a-business-in-kenya/investment-incentives/
- (25) Kenya Revenue Authority. Investing in Kenya. https://www.kra.go.ke/en/ngos/incentives-investors-certificate/investing-in-kenya/incentives-investors
- (26) Ministry of Agriculture, Livestock and Fisheries (2020). Nuts And Oil Crops Bill. Republic of Kenya. https://www.kilimo.go.ke/wp-content/uploads/2020/11/NUTS-AND-OIL-CROPS-BILL-2020-1-9-2020.pdf
- (27) Ministry of Agriculture, Livestock and Fisheries (2020). The Horticultural Crops Authority Bill. Republic of Kenya. https://www.kilimo.go.ke/wp-content/uploads/2020/10/HCD-BILL.pdf
- (28) Kenya Agribusiness and Agroindustry Alliance. Agriculture Investment Opportunities in Kenya: Mango Production Investment Case. http://kaaa.co.ke/wp-content/uploads/2016/03/Mango-Production-Investment-Opportunity.pdf
- (29) FSD Kenya (2015). Opportunities for financing the mango value chain: A case study of Lower Eastern Kenya. http://s3-eu-central-1.amazonaws.com/fsd-circle/wp-content/uploads/2015/08/30093918/15-06-29-Mango-value-chain-report.pdf
- (30) International Trade Centre (2014). Road Map for Developing and Strengthening the Processed Mango Sector. https://www.intracen.org/uploadedFiles/Kenia-Mango%20Roadmap_final.pdf
- (31) Viffa Consult (2020). State of coconut commodity market in Kenya: SME Market Opportunity Outlook. http://viffaconsult.co.ke/wp-content/uploads/2020/07/State-of-Coconut-Commodity-Market-in-Kenya.pdf
- (32) Best Tropical Fruits (2021). https://www.besttropicalfruits.com/
- (33) Deutsche Welle (2013). Women take over Kenya's farming sector. https://www.dw.com/en/women-take-over-kenyas-farming-sector/a-16716322
- (34) SDG Tracker (2021). End poverty in all its forms everywhere. https://sdg-tracker.org/no-poverty