


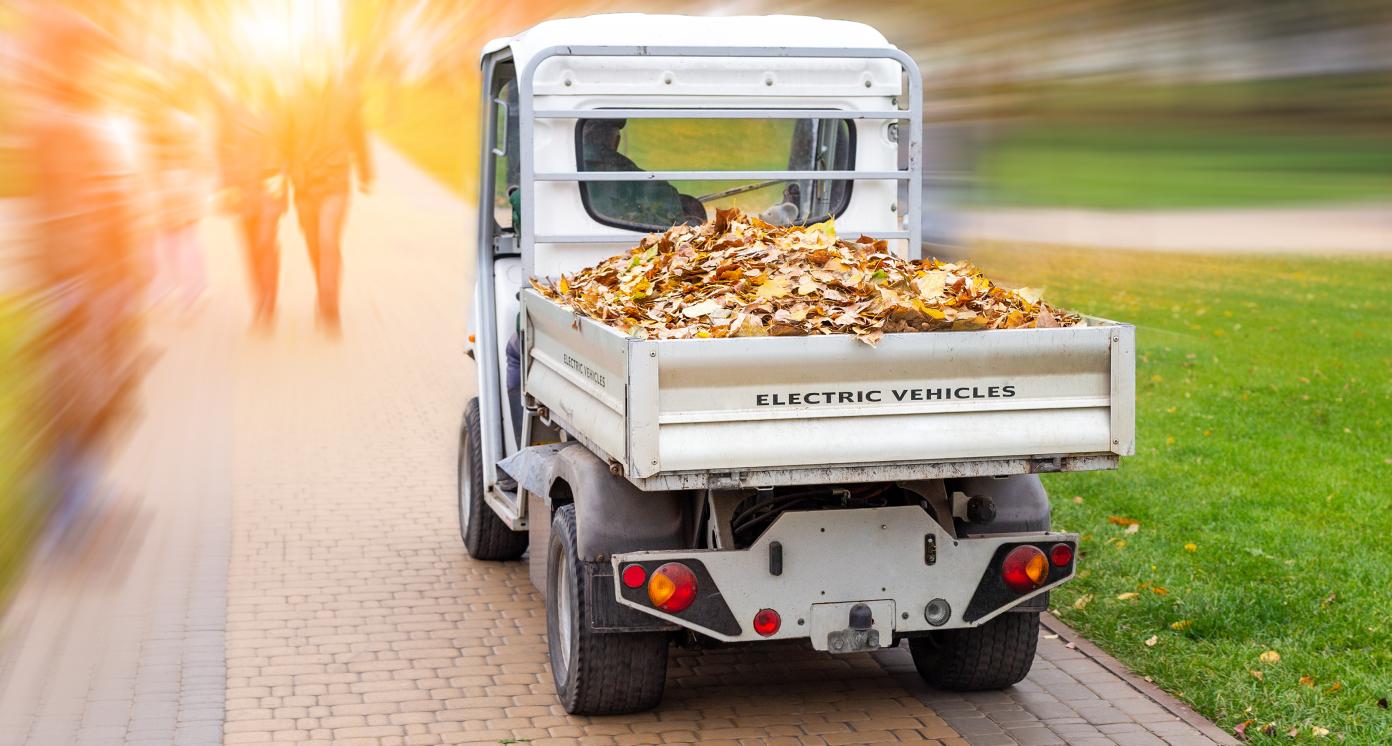
EV based services for logistics, hyperlocal delivery and micro-mobility
EV based services for logistics, hyperlocal delivery and micro-mobility

Business Model Description
EV based ride-sharing or rental services (EV buses, E-taxis, E-rickshaws or E-bikes), offering inter-city and intra-city, affordable micro-mobility, logistics or hyperlocal delivery services.
Expected Impact
Reduction in carbon emissions by switching transportation dependence from oil to clean energy based transport such as Electric Vehicles for personal and public transportation needs.
How is this information gathered?
Investment opportunities with potential to contribute to sustainable development are based on country-level SDG Investor Maps.
Disclaimer
UNDP, the Private Finance for the SDGs, and their affiliates (collectively “UNDP”) do not seek or solicit investment for programmes, projects, or opportunities described on this site (collectively “Programmes”) or any other Programmes, and nothing on this page should constitute a solicitation for investment. The actors listed on this site are not partners of UNDP, and their inclusion should not be construed as an endorsement or recommendation by UNDP for any relationship or investment.
The descriptions on this page are provided for informational purposes only. Only companies and enterprises that appear under the case study tab have been validated and vetted through UNDP programmes such as the Growth Stage Impact Ventures (GSIV), Business Call to Action (BCtA), or through other UN agencies. Even then, under no circumstances should their appearance on this website be construed as an endorsement for any relationship or investment. UNDP assumes no liability for investment losses directly or indirectly resulting from recommendations made, implied, or inferred by its research. Likewise, UNDP assumes no claim to investment gains directly or indirectly resulting from trading profits, investment management, or advisory fees obtained by following investment recommendations made, implied, or inferred by its research.
Investment involves risk, and all investments should be made with the supervision of a professional investment manager or advisor. The materials on the website are not an offer to sell or a solicitation of an offer to buy any investment, security, or commodity, nor shall any security be offered or sold to any person, in any jurisdiction in which such offer would be unlawful under the securities laws of such jurisdiction.
Country & Regions
- India: Countrywide
Sector Classification
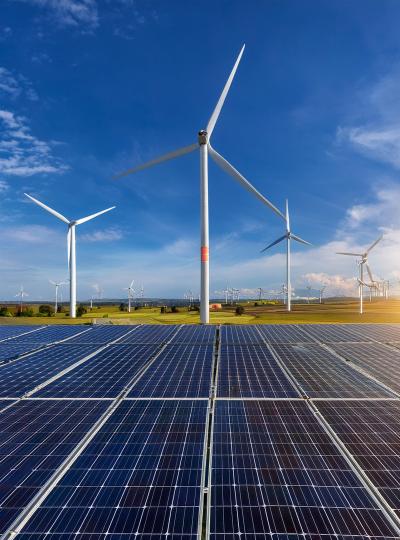
Renewable Resources and Alternative Energy
Development need
India ranks 9 in Climate Change Performance Index (3.1) and is one of the most vulnerable countries in the world to global warming.
It is also highly vulnerable to climate-induced natural disasters, that make communities vulnerable based on their socio-economic and geophysical characteristics.
Power generation from renewable energy sources in India reached 101.84 billion units in 2018 and 126.76 billion units in 2019. Going forward, renewable energy is expected to account for ~55% of the total installed power capacity by 2030 (3.3).
Nationwide lockdown created disrupted supply chains across sectors and intensified the urgency for India to become self-sufficient to meet its energy needs and reduce its dependency on import of crude oil for generation of electricity, as well as transport facilities consumption.
Policy priority
India plans to add 30 GW of renewable energy capacity along the desert region on its western border, covering the states of Gujarat and Rajasthan.
The Delhi government has decided to shut down the thermal power plant in Rajghat and plans to develop it into a 5,000 KW solar park.
A new Hydropower policy for 2018-28 has been drafted for the growth of hydro projects in the country.
The Government of India has announced plans to implement a USD 238 million National Mission on advanced ultra-supercritical technologies for cleaner coal utilisation.
Gender inequalities and marginalization issues
As per SDG India Index report by Niti Aayog (3.2a), 99.99% (3.2b) households have access to electricity and 17 States and all UTs (except Lakshadweep) had shown substantial progress in respect to achieving SDG 7 (Affordable and Clean Energy), resulting in a cumulative score of 70 on 100 for India for SDG 7.
Women benefit from clean energy used for cooking as it helps them save the time spent gathering dirty fuels such as firewood or cow dung, and reduces exposure to indoor air pollution (responsible for 3.8 million premature deaths a year). (8.34)
Investment opportunities introduction
The Government of India has set a target to achieve renewable energy capacity of 175 GW by 2022 and 450 GW by 2030. As of 30 April 2020, India’s installed RE capacity stands at 87.26 GW (3.7), which includes 34.81 GW of solar, 37.74 GW of wind, 9.86 GW of biomass and 4.68 GW of small hydro. To achieve its target of 175 GW of renewable energy capacity by 2022, the government has estimated an additional investment requirement of USD 100 billion over the course of the next 3 years (3.8), which would require increased capital inflow from both Indian and international investors. As per Foreign Direct Investment (FDI) Policy, up to 100% FDI is allowed under the automatic route for renewable energy generation and distribution projects subject to provisions of The Electricity Act, 2003 (3.9).
Key investment deals in Indian RE sector amounted to USD 8.4 billion (3.10), of which 48% was in generalised renewable energy, 41% was in solar, 10% was in wind, while 1% was for storage or solar pumps.
Key bottlenecks introduction
In India, power demand has reduced by 25-30%. This decline in demand coupled with reduced collection of payments and slow economic recovery will adversely impact already stressed Distribution Companies (DISCOMS) by creating a cash gap of approximately USD 5 billion. (3.12)
Alternative Energy
Development need
Being home to 14 out of the 20 most polluted cities in the world, the challenge posed by pollution demands immediate attention in India. (3.2a)
Additionally, transition to Electric Vehicles (EVs) also has the potential to significantly cut India’s import bill for crude oil which stood at nearly USD 85 billion in 2020 (3.6). By December 2019, close to USD 40 billion has been invested in companies toward building solutions for the electric vehicles sector across the globe. India accounts for merely ~1.6% of this. (3.6)
The Delhi government released the draft “Delhi Electric Vehicle Policy 2020,” which aims to increase the market share of battery-electric vehicles to 25% of all new vehicles by 2024. (9.13) Similar policies are expected to be put in place by other regions in the country as well.
Gender inequalities and marginalization issues
Electricity being a key ingredient for any modern production infrastructure, gaps in energy supply often act as a barrier to productive investments in rural and semi-urban areas. Distributed renewable energy and cleantech solutions can effectively bridge such energy gaps in an environment-friendly way. This facilitates local value addition by creating more productive investment opportunities, specifically in micro-enterprises, while also creating demand for skilled and semi-skilled manpower. (3.13) Making such shifts will align with COVID-19 measures announced by GoI to spur the growth of MSMEs to improve domestic manufacturing and production capacities.
Investment opportunities introduction
The shared mobility market in India is one of the largest in the world with 3.5 million rides per day. In value terms, the shared mobility market was USD 1 billion in 2019 and is poised for the rapid growth of ~25-30% CAGR over the next five years. The ride-hailing segment contributes to 74% of the total value of the shared mobility market. (10.9)
Key bottlenecks introduction
EV based car-hire companies have not taken off in a big way because of many challenges such as cost, battery life, safety (possibility of battery explosions), infrastructure for battery charging and public perception. (10.10)
Fuel Cells and Industrial Batteries
Pipeline Opportunity
EV based services for logistics, hyperlocal delivery and micro-mobility
EV based ride-sharing or rental services (EV buses, E-taxis, E-rickshaws or E-bikes), offering inter-city and intra-city, affordable micro-mobility, logistics or hyperlocal delivery services.
Business Case
Market Size and Environment
> USD 1 billion
> 25%
The shared mobility market is one of the fastest-growing markets in India, with a market opportunity of USD 4.5 billion. (10.3) and with 3.5 million rides per day.
In value terms, the shared mobility market was USD 1 billion in 2019 and is poised for a rapid growth of ~25-30% CAGR over the next five years. The ride hailing segment contributes to 74% of the total value of the shared mobility market. (10.9)
Indicative Return
10% - 15%
Although EV sector requires lesser capital and generates high returns, private investment in EV sector is low in terms of deal volume (in comparison to other sectors). (10.6)
In Jan 2020, Bounce (Scooter sharing service) reported over 5x growth in its annual revenue (USD 2 million in 2020), despite incurring losses resulting from high operating costs involved in an early stage business (marketing, or other operating costs). (10.7)
As of June 2020, Yulu’s (Micro-mobility solutions that help reduce traffic congestion and air pollution) earned USD 112,543 in operating revenue during FY19 and projects a 10.7X topline jump in FY20. (10.8)
Investment Timeframe
Medium Term (5–10 years)
Most companies in this segment are likely to take ~5-15 years before they become profitable. Bounce, which was founded in 2014 and raised Series D funding in January of 2020, expects to become profitable by 2023 and earn nearly USD 11 million in revenue in 2020, up five-fold from 2019. (10.7)
Investors expect the whole EV industry (manufacturing, trading and servicing segment) to take ~8-10 years before it can start generating profits.
For the services segment under the EV industry, consolidation of players could be a trend before they become acquisition targets for the likes of Ola or Uber. (3.6) However, for any exit to materialise, these start-ups will first need to prove themselves through differentiated technology and validation through revenues. (3.6)
Market Risks & Scale Obstacles
Fragmented Market Ecosystem
Capital - CapEx Intensive
Impact Case
Sustainable Development Need
In India, annual rides with taxi aggregators (such as Ola and Uber) increased from 130 million rides in 2015 to 500 million rides in 2016, with such taxi aggregators accounting for 72% of the overall shared mobility market. Thus, high penetration of shared mobility in India results in higher vehicle utilisation, which can support high demand for EVs. (9.2)
Road transport alone contributed to 87% of the CO2 emissions. (10.1) Transport’s share of Nitrogen Oxide (NOX) emissions stood at ~40% in 2019, and is expected to decline to less than 20% in 2040 with application of more stringent norms applied under Bharat VI emission standards, as well as growing number electric vehicles on the roads. (9.4)
An estimated 74,000 premature deaths were attributable to transportation emissions in India in 2015. This represents a 28% increase in annual transportation-attributable deaths in India compared with 2010. (9.5)
As the share of miles driven by EVs increases, urban mobility emissions will decrease progressively; electrification combined with a clean energy mix and optimized charging patterns will further reduce emissions, improving air quality and benefiting human health, with a much-decreased ecological footprint. (10.2)
India is heavily dependent on oil imports, with a USD 112 billion oil import bill in 2019 (9.3), 80% of which is used for transport fuel. The demand for transport fuel is set to grow as a rapidly urbanizing population demands greater intra-city and inter-city mobility. (9.2) As per Niti Aayog, India has over 170 million two-wheelers. If we assume that each of these vehicles uses a little more than half a litre of petrol per day or about 200 litres per year, the total amount of petrol used by such vehicles is about 34 billion litres. At ₹70 per litre, this would cost about USD 32 billion. Even if we assume that 50% of this is the cost of imported crude (as tax and other may be 50%), one may save USD 16 billion worth of imported oil. (9.2)
GOI proposed a plan to convert all two-wheelers up to 150cc (which currently constitute 90% of the total two-wheeler market in India) electric by 2025. Two-wheelers contribute to ~60-65% of India's total annual petrol consumption. (10.3)
Electric vehicles offer lower operating costs than their petrol, diesel and CNG counterparts for all types of vehicles – 2 wheelers, 3 wheelers, cars, buses and trucks. The operating cost per km comes down to 40% or lower for each type of vehicle. (3.6)
EVs offer cost-efficient solutions for e-commerce and hyperlocal delivery firms. With use of EVs (instead of petrol-based scooters used for deliveries), delivery personnel are not only able to save on the fuel cost incurred, but also increase their net income by ~30%-40% per month. (10.4)
Gender & Marginalisation
Electricity being a key ingredient for any modern production infrastructure, gaps in energy supply often act as a barrier to productive investments in rural and semi-urban areas. Distributed renewable energy and cleantech solutions can effectively bridge such energy gaps in an environment-friendly way. This facilitates local value addition by creating more productive investment opportunities, specifically in micro enterprises, while also creating demand for skilled and semi-skilled manpower. (3.13) Making such shifts will align with COVID-19 measures announced by GoI to spur growth of MSMEs to improve domestic manufacturing and production capacities. Women benefit from clean energy used for cooking as it helps them save the time spent gathering dirty fuels such as firewood or cow dung, and reduces exposure to indoor air pollution (responsible for 3.8 million premature deaths a year). (8.34)
Expected Development Outcome
The business models under this IOA have the potential to reduce primary oil consumption in transportation. They can also offer affordable and energy-efficient transportation services for personal and commercial purposes. Further, these business models may also reduce GHG emissions from vehicular pollution in cities A key contribution could also be towards facilitating employment growth in a sun-rise sector. (9.2)
Gender & Marginalisation
Primary SDGs addressed
7.2.1 Renewable energy share in the total final energy consumption
7.3.1 Energy intensity measured in terms of primary energy and GDP
9.4.1 CO2 emission per unit of value added
13.2.1 Number of countries with nationally determined contributions, long-term strategies, national adaptation plans, strategies as reported in adaptation communications and national communications
Secondary SDGs addressed
Directly impacted stakeholders
People
Planet
Corporates
Public sector
Indirectly impacted stakeholders
Public sector
Impact Classification
What
This will lead to establishment of a sustainable commercial transport system.
Who
EV-owners benefit from a low TCO for an EV in comparison to that of a petrol/ diesel vehicle. Commuters benefit from affordable transport solutions and lower transaction costs
Risk
This model can only be successful if adequate charging infrastructure is installed across the country.
Impact Thesis
Reduction in carbon emissions by switching transportation dependence from oil to clean energy based transport such as Electric Vehicles for personal and public transportation needs.
Enabling Environment
Policy Environment
Government of India is targeting a fully electric fleet for public transport, including buses, taxis and auto-rickshaws under the second phase of FAME India scheme. Department of Heavy Industries (DHI) emphasised that public transport should be 100% electric, as it will help to reduce pollution to a great extent. (9.7) This will help in offering a conducive environment for shared mobility service providers (like Ola / Uber) and EV based delivery service providers.
Financial Environment
Financial incentives: The details of subsidy proposed under second phase of FAME-I program is as follows: (9.7) - Buses - USD 99,302 to USD 132,403 (60% of total cash) - Electric Taxi - USD 1642 (10-15% of total cash) - Electric Auto - USD 490 to USD 808 (20% of total cash)
Regulatory Environment
Ministry of Heavy Industries (MoHI) supports RD&D in the automotive sector through the Automotive Research Association of India (ARAI). ARAI carries out research in fuel economy, emissions reductions, light-weighting, biomass engines and electric vehicles (EVs), with public-private funding. (9.4)
MoHI, Government of India has shortlisted 11 cities in the country for introduction of EVs in their public transport systems under the FAME (Faster Adoption and Manufacturing of (Hybrid) and Electric Vehicles in India) scheme. The Government will also set up incubation centre for start-ups working in the EVs space. (9.6)
Marketplace Participants
Private Sector
Investors: Softbank Corp, Arun Sarin Family, Ratan Tata, Matrix Partners India, Tiger Global, Hero Motocorp, Sachin Bansal, Mitsui PE, Bajaj Auto; B Capital, Accel, Sequoia Capital India, Qualcomm Ventures, Chiratae Ventures, IDG Ventures and ON Mauritius; TATA and Mahindra.
Private Sector
Corporations: Ola Electric Mobility, SmartE, Yulu; Bounce, Vogo, Lithium Cabs, B-Live, Zypp.
Non-Profit
LetsVenture, an online funding platform for startups has also launched LetsAccelerate’s EV Innovation Labs to help EV startups in India access resources to become investment and market-ready. (9.19) Looking to stimulate and strengthen the EV startup ecosystem, incubator and accelerator Huddle and early-stage venture capital firm GrowX ventures have announced India’s first acceleration programme for EV startups. (9.19).
Target Locations

India: Countrywide
References
- (3.1 https://www.climate-change-performance-index.org/country/india#:~:text=Donate-,India,Emissions%20and%20Energy%20Use%20categories. 3.2a https://niti.gov.in/sites/default/files/2019-12/SDG-India-Index-2.0_27-Dec.pdf 3.2b https://saubhagya.gov.in/ 3.3 https://www.ibef.org/industry/renewable-energy-presentation 3.4 https://www.carbonbrief.org/analysis-indias-co2-emissions-growth-poised-to-slow-sharply-in-2019 3.5 https://energy.economictimes.indiatimes.com/energy-speak/the-future-of-renewable-energy-in-india/3016 3.6 https://inc42.com/resources/electric-vehicles-the-segment-of-choice-to-invest-in-2020/ 3.7 https://www.ibef.org/industry/renewable-energy.aspx 3.8 https://energy.economictimes.indiatimes.com/news/renewable/another-100-billion-investment-required-to-meet-175-gw-re-target-MNRE-secy/73806002 3.9 https://www.investindia.gov.in/foreign-direct-investment 3.10 https://psuwatch.com/india-36-gw-renewable-energy-target-450-gw-2030-ieefa 3.11 https://www.livemint.com/news/india/train-journeys-could-leave-zero-carbon-footprint-by-2030-here-s-how-11594684996911.html 3.12 https://energy.economictimes.indiatimes.com/energy-speak/renewable-energy-new-normal-and-impact-of-covid-19/4167#:~:text=are%20being%20observed.-,In%20India%2C%20at%20present%20power%20demand%20has%20reduced%20by%2025,40%2C000%20cr. 3.13 https://energy.economictimes.indiatimes.com/news/renewable/covid-19-re-look-clean-energy-for-resilient-india/75299079
- (10.1 http://bwsmartcities.businessworld.in/article/Goa-Embraces-India-s-First-Electric-Vehicle-Tourism/05-06-2019-171464/ 10.2 https://fleetonomy.io/electric-vehicle-mobility-services-overcoming-the-challenges-of-operating-an-electric-vehicle-fleet-based-service/#:~:text=With%20regard%20to%20the%20environment,quality%20and%20benefiting%20human%20health%2C 10.3 https://www.newindianexpress.com/business/2019/dec/31/ev-makeover-scooter-sharing-service-provider-bounce-gears-up-for-next-wave-of-change-2083112.html 10.4 https://www.livemint.com/companies/start-ups/e-commerce-hyperlocal-supply-chains-to-get-cheaper-with-ev-adoption-11598958177558.html 10.5 https://evduniya.com/ev-india/what-is-the-cost-of-running-an-electric-vehicle-in-india-vs-fuel-vehicle.html 10.6 https://yourstory.com/2019/03/electric-vehicles-profitable-ev-bike-sharing-rentals-nwbbq7c44n 10.7 https://www.techcircle.in/2020/01/09/bounce-raises-97-million-in-series-d-eyes-profit-in-fy23 10.8 https://entrackr.com/2020/06/exclusive-yulu-valuation-rs-585-cr-revenue-jump-in-fy20/ 10.9 https://auto.economictimes.indiatimes.com/news/industry/opinion-ev-adoption-in-shared-mobility-segment-a-game-changer-for-indian-automobile-industry/72022796#:~:text=The%20shared%20mobility%20market%20in%20India%20is%20one%20of%20the,over%20the%20next%20five%20years. 10.10 https://www.livemint.com/Companies/JezSx7LG5lVZrXnkuM1XwN/Lithium-Urban-Tech-paves-the-way-for-EV-revolution-in-India.html 10.11 https://www.financialexpress.com/economy/power-up-all-india-average-electricity-cut-duration-falls-in-may/1608184/ 10.12 https://www.prnewswire.com/news-releases/india-commercial-vehicles-industry-report-2019---market-expected-to-grow-at-a-cagr-of-2-97-from-2018-to-2030--300966849.html#:~:text=The%20commercial%20vehicle%20market%20in,buses%20performing%20at%204.36%25%20CAGR. 10.13 http://www.fii-news.com/evs-can-help-reduce-1-giga-tonne-emission-india/