


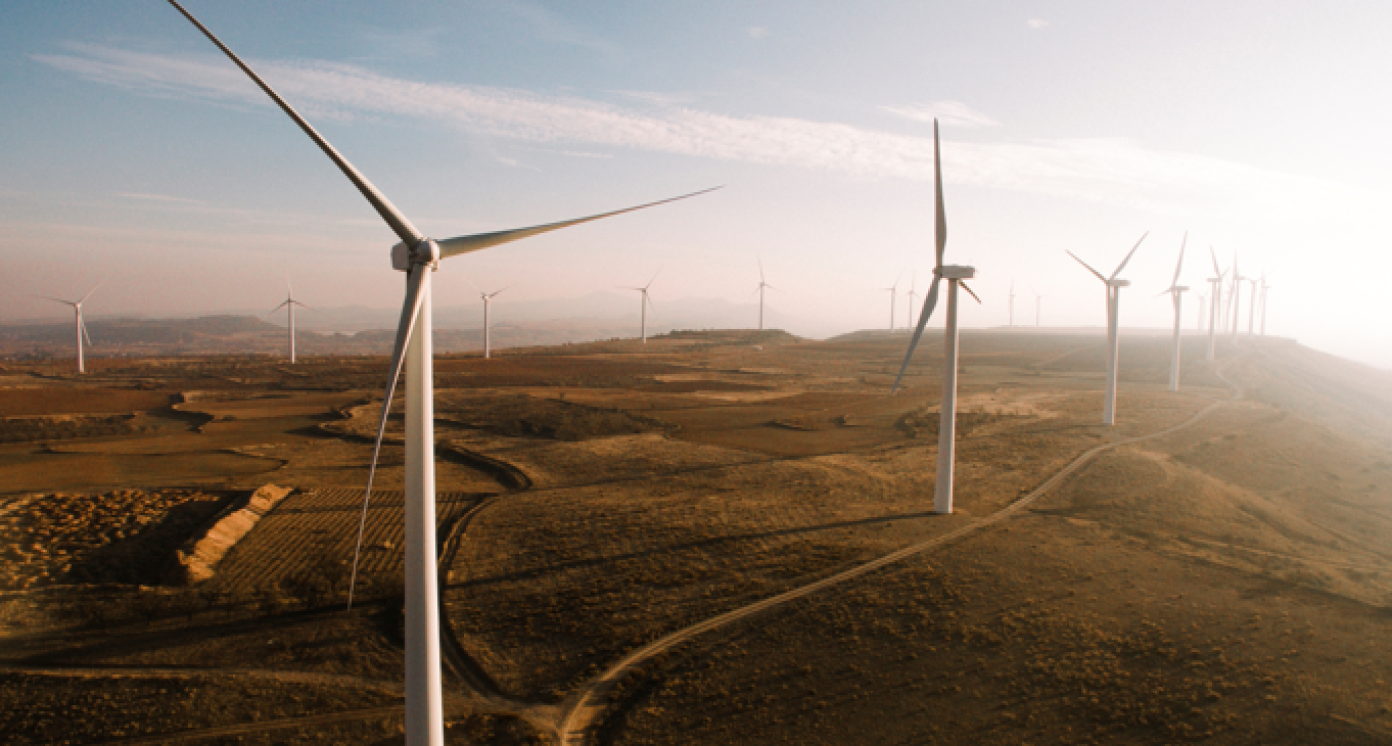
Energy Efficiency Technologies for Industrial, Agricultural and Residential Areas
Energy Efficiency Technologies for Industrial, Agricultural and Residential Areas
Business Model Description
Promote energy efficiency through the integration of IOT and software services
Expected Impact
Energy efficiency investments increase the share of renewables in the energy portfolio and contribute to energy security while reducing CO2 emissions.
How is this information gathered?
Investment opportunities with potential to contribute to sustainable development are based on country-level SDG Investor Maps.
Disclaimer
UNDP, the Private Finance for the SDGs, and their affiliates (collectively “UNDP”) do not seek or solicit investment for programmes, projects, or opportunities described on this site (collectively “Programmes”) or any other Programmes, and nothing on this page should constitute a solicitation for investment. The actors listed on this site are not partners of UNDP, and their inclusion should not be construed as an endorsement or recommendation by UNDP for any relationship or investment.
The descriptions on this page are provided for informational purposes only. Only companies and enterprises that appear under the case study tab have been validated and vetted through UNDP programmes such as the Growth Stage Impact Ventures (GSIV), Business Call to Action (BCtA), or through other UN agencies. Even then, under no circumstances should their appearance on this website be construed as an endorsement for any relationship or investment. UNDP assumes no liability for investment losses directly or indirectly resulting from recommendations made, implied, or inferred by its research. Likewise, UNDP assumes no claim to investment gains directly or indirectly resulting from trading profits, investment management, or advisory fees obtained by following investment recommendations made, implied, or inferred by its research.
Investment involves risk, and all investments should be made with the supervision of a professional investment manager or advisor. The materials on the website are not an offer to sell or a solicitation of an offer to buy any investment, security, or commodity, nor shall any security be offered or sold to any person, in any jurisdiction in which such offer would be unlawful under the securities laws of such jurisdiction.
Country & Regions
- Tunisia: Centre-West
- Tunisia: South East
- Tunisia: Centre-East
Sector Classification
Technology and Communications
Development need
A digital gap disproportionately affects SMEs, non-exporting businesses, and interior regions. The economy's slow rate of digitization stymies innovation and business growth.
Despite hosting one of the most developed broadband infrastructures in the MENA region, Tunisia still faces challenges in ensuring inclusive access to Internet services especially in rural areas. In fact, according to World Bank data, the country has a slightly lower Internet penetration rate (66.7%) than the MENA region (71.8%) as of 2019 (14).
Policy priority
The 2016-2020 Development Plan places particular emphasis on bridging the digital gap by connecting every household and business to the internet. Tunisia puts a premium on promoting innovative small and medium-sized enterprises (SMEs) in the information and communications technology sector (1).
Gender inequalities and marginalization issues
Tunisia has a gender parity score of 3.75/7 in tech jobs, according to the Global Gender Gap Report 2020. It records a 37.8% female attainment in STEM subjects (compared to 57.2% male attainment) and a 14.3% female attainment in ICT (compared to 19.1% for men) (2).
Investment opportunities introduction
Tunisia is one of the top South-Mediterranean nations in terms of the number of innovative financing schemes and incentives available for the creation of software and digital services, as well as for businesses to invest in digital, R&D, and ICT material.
Key bottlenecks introduction
Access to the internet by rural and inland populations may provide problems for the technology and communications sector's development. Few telecommunications firms still engage in oligopolistic behavior, even when they are heavily regulated by the state.
Technology
Development need
Technological innovation is slowed by a low degree of economic digitization and an insufficient amount of R&D. Tunisia requires technical improvement in order to adapt to and reduce the effects of climate change on its high vulnerability.
According to Tunisia’s 2021 NDCs, financing needs for energy efficiency are estimated at approximately USD 5.8 billion (15). Tech solutions could provide significant progress in ensuring energy efficiency.
Policy priority
The National Voluntary Report on the Implementation of the Sustainable Development Goals (SDGs) encourages the transfer of technologies for climate adaptation and mitigation, among other things (3,4).
Gender inequalities and marginalization issues
Tunisia has a gender parity score of 3.75/7 in tech jobs, according to the Global Gender Gap Report 2020. It records a 37.8% female attainment in STEM subjects (compared to 57.2% male attainment) and a 14.3% female attainment in ICT (compared to 19.1% for men) (2).
Investment opportunities introduction
Tunisia has 11 operating technoparks organized in clusters of competitiveness in the sectors of scientific-technical research, manufacturing, and technological development. Additionally, it established 15 cyberparks focused on software development, website construction, and ICT services, which serve as incubators for ICT-related firms (5,6).
Key bottlenecks introduction
Most technology businesses are still in their early stages and are modest in comparison to competitive global corporations, which often receive more support from the government than local SMEs. Furthermore, funding for research and development in the area is currently limited.(7,8)
Software and IT Services
Pipeline Opportunity
Energy Efficiency Technologies for Industrial, Agricultural and Residential Areas
Promote energy efficiency through the integration of IOT and software services
Business Case
Market Size and Environment
5% - 10%
The energy efficiency market in the region is experiencing a growth of 5-10% (9).
Indicative Return
15% - 20%
EBIT from energy efficiency investments in the region is estimated to be between 10% and 15% (9), pointing towards a slightly higher gross profit margin around 15%-20%.
Investment Timeframe
Medium Term (5–10 years)
Investment timeframe is provided by recent experience in the Maghreb region (9).
Ticket Size
USD 1 million - USD 10 million
Market Risks & Scale Obstacles
Market - High Level of Competition
Market - Highly Regulated
Impact Case
Sustainable Development Need
Energy industry in Tunisia stays highly dependent on the fossil fuel market (99%), meanwhile oil production has declined while electricity consumption has increased. This situation led to transform the country into an energy importer, leading among others factors to a trade deficit (10).
Tunisia needs to reduce its carbon footprint given dependence on fossil fuels. According to the Tunisian solar plan, the share of solar energy PV should reach 1,510 MW by 2030, with a diminution of carbon footprint by 41% for 2030 (10).
Gender & Marginalisation
While women are mainly present in administration position, they are in minority in the energy sector, and even more at managerial positions where men occupy 94% (11).
Expected Development Outcome
Improvements in energy efficiency technology will increase commercial viability of renewable energy further, increasing their share in the electricity mix.
Investments in energy efficiency technology will allow the reinforcement of the network and the production capacity to reach a capacity of 3,815 MW by 2030 as outlined in the Tunisian Solar Plan (12).
Gender & Marginalisation
The share of women working in software development could be increased while electricity costs could be lowered through enhanced efficiency.
Primary SDGs addressed
7.2.1 Renewable energy share in the total final energy consumption
3.85 (13)
N/A
7.b.1 Installed renewable energy-generating capacity in developing countries (in watts per capita)
7.1.1 Proportion of population with access to electricity
13.2.2 Total greenhouse gas emissions per year
0.118868 (13)
99.10% (13)
2.65 tCO2/capita (13)
30% by 2030 (13)
1 (13)
0 (13)
Secondary SDGs addressed
Directly impacted stakeholders
People
Planet
Gender inequality and/or marginalization
Corporates
Public sector
Indirectly impacted stakeholders
People
Outcome Risks
Energy efficiency solutions may create a false feeling of unconditional decrease in energy consumption, which may instead cause an unintended increase in consumption.
Impact Risks
Depending on the technology behind the tools and systems, if the energy efficiency solutions do not operate as efficiently as planned, the impact may be limited.
Impact Classification
What
Provide a sustainable energy and reduce carbon footprint
Who
Electricity consummers, with agricultural and industrial who are important electricity consummers.
Risk
While energy efficiency technologies model is proven, efficiency of the solutions and expectations of different users require consideration.
Impact Thesis
Energy efficiency investments increase the share of renewables in the energy portfolio and contribute to energy security while reducing CO2 emissions.
Enabling Environment
Policy Environment
Economic Recovery Plan 2019-2020: Increase the share of reneweable energies in electricity production to 30% in 2030 (wind, solar photovoltaic, and thermal)
National Sustainable Development Strategy 2015-2020: Willingness to establish sustainable consumption and production integrating the concept of green economy.
Financial Environment
Financial incentives: Law n2016-71 of September 30, 2016 on the Investment Law and Government Decree n2007-389 of March 9, 2017: Investments in the renewable energy sector shall benefit from bonuses: Prime of the increase of the added value and competitiveness: 15% of the approved investment cost with a ceiling of 1 Million Dinars
Prime of sustainable development: First group of regional development zone should benefit of 15% of the approved investment costs with a ceiling of 1 Million TND (350,000 USD) and Second group of regional development zones: 30% of the approved investment cost with a ceiling of 3 million TND (1 million USD)
Fiscal incentives: Law No. 2007-8 of February 14, 2017 on the revision of the tax benefits system: Investments made in the renewable energy sector benefit from deductions from the base of personal income tax, corporate tax, income or profits from investments: 1st group of regional development zones: for 5 years 2nd group of regional development zones: for 10 years
Other incentives: May 2019: Amendment of the law to promote the production of electricity from renewable sources and to improve the investment climate (Law No. 2019-47)
Regulatory Environment
February 2020: Adoption of a governmental decree setting the conditions and modalities of realization of projects of production and sale of electricity from renewable energies (Decree n° 2020-105)
Decree-Law n85-8 of September 14, 1985,This law implements measures to encourage energy conservation
Law n12 of May 11, 2015 on the production of electricity from renewable energy.
Law n85-48 of April 25, 1985, encouraging research, production and marketing of renewable energy
The Decree 2017-983 of July 26th 2017 regulates the Energy Transition Fund (FTE).
Marketplace Participants
Private Sector
Co-Solar, Smart eTech, Wattnow, Attijari Bank
Government
Government:The National Agency for Energy Transformation (ANME), Tunisian Electricity and Gas Company (STEG), the General Direction of Electricity and Renewable Energies (DGEER), The Technical Commission of private production of electricity from renewable energies (CTER)
Multilaterals
UNDP, EU, African Development Bank, GCF, UNEP, IFC, GIZ, AfD, Islamic Development Bank
Target Locations

Tunisia: Centre-West
Tunisia: South East
Tunisia: Centre-East
References
- (1) Republic of Tunisia, 2016-2020 Development Plan, http://www.tunisie.gov.tn/uploads/Document/02/978_445_Plan-developpement_2016_2020.pptx
- (2) WEF, 2020. Global Gender Gap Report. http://www3.weforum.org/docs/WEF_GGGR_2020.pdf
- (3) The Republic of Tunisia, 2021. Voluntary National Review 2021. https://sustainabledevelopment.un.org/content/documents/279442021_VNR_Report_Tunisia.pdf
- (4) The Republic of Tunisia, 2019. Voluntary National Review 2019. https://sustainabledevelopment.un.org/index.php?page=view&type=111&nr=23372&menu=35
- (5) Tunisia Investment Authority. https://tia.gov.tn/storage/app/media/ARGUMENTAIRES/TIA_TUNISIA_PHARMA/AG%20PHARMA%20ANG.pdf
- (6) Ministry of Industry, Energy and Mines, 2021. Centre d’innovation et de développement technologique. http://www.tunisieindustrie.nat.tn/fr/doc.asp?mcat=22&mrub=177
- (7) Government of Canada. https://www.tradecommissioner.gc.ca/secure-securisee/sign-in-inscrivez-vous.aspx?lang=eng&ur=/tunisia-tunisie/market-reports-etudes-de-marches/0002801.aspx?lang=eng
- (8) GIZ. Améliorer l’efficacité énergétique en Tunisie. https://www.giz.de/en/worldwide/82632.html
- (14) World Bank Data, 2021. https://data.worldbank.org/indicator/IT.NET.USER.ZS?locations=ZQ-TN
- (15) Republic of Tunisia, October 2021. Contribution Determinee au niveau National (CDN) actualisee. https://www4.unfccc.int/sites/ndcstaging/PublishedDocuments/Tunisia%20First/Tunisia%20Update%20NDC-french.pdf
- (9) Ministère de l'Industrie et du Commerce. Projet 134. https://banquedeprojets.mcinet.gov.ma/.
- (10) Solar Power Europe/Tunisia, 2020. Solar Investment Opportunities- Emerging Markets taks force report. https://www.solarpowereurope.org/wp-content/uploads/2020/02/SolarPower-Europe_Tunisia-Solar-Investment-Opportunities.pdf
- (11) MED ENER, 2019. ANME HIGHLIGHTS SMALL PERCENTAGE OF WOMEN IN TUNISIA’S ENERGY MANAGEMENT SECTOR. https://www.medener.org/en/anme-highlights-small-percentage-of-women-in-tunisias-energy-management-sector/
- (12) Ministry of Industry and SMEs and ANME, 2019. PROJETS D’ÉNERGIE RENOUVELABLE EN TUNISIE. https://www.energiemines.gov.tn/fileadmin/docs-u1/Guide_Detaillé_Energie_Renouvelable_Tunisie.pdf
- (13) Sustainable Development Solutions Network (SDSN) and the Bertelsmann Stiftung, 2021. Sustainable Development Report 2021. Tunisia Profile. https://dashboards.sdgindex.org/profiles/tunisia