Dry sanitation technologies
Business Model Description
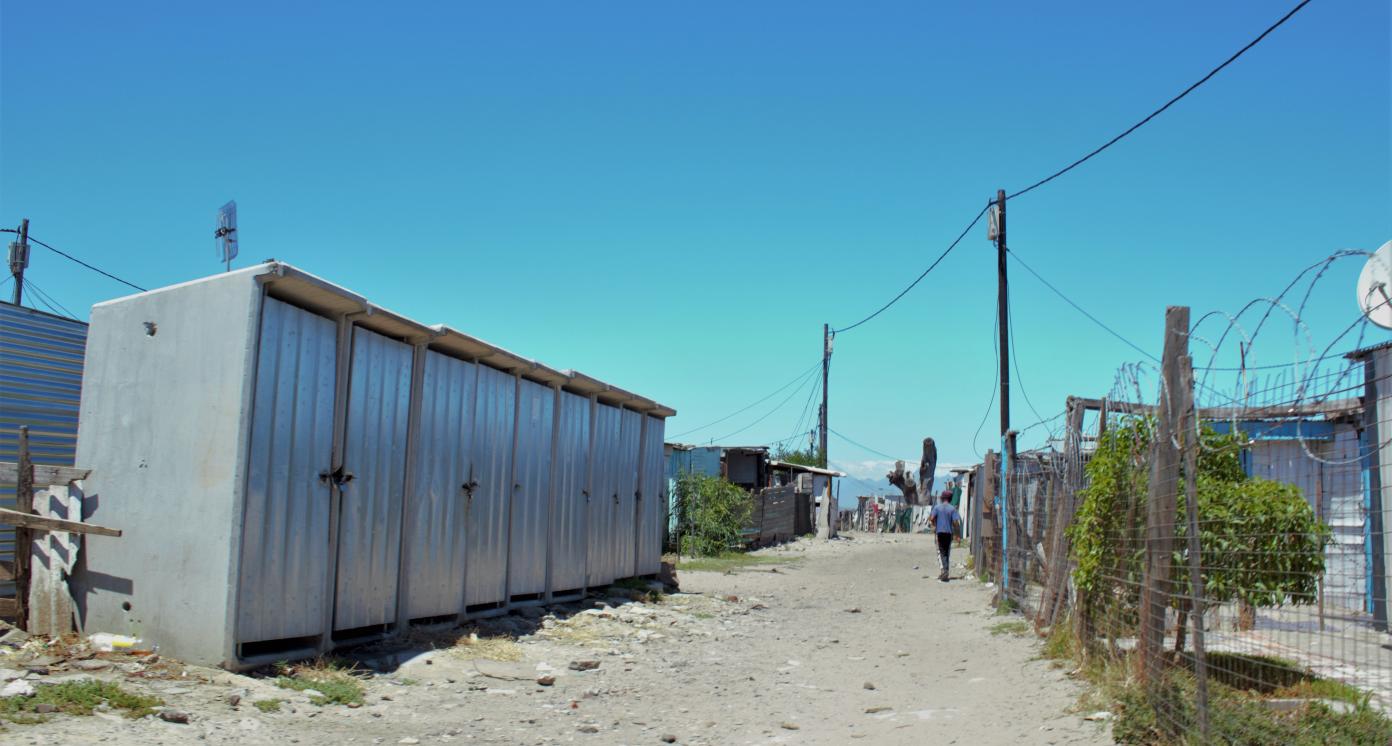
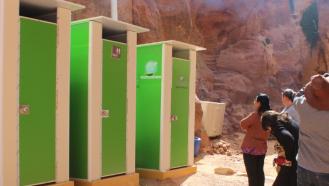
Develop and provide self-sufficient dry on-site toilets in peri-urban and informal settlements that are outside the network of a wastewater treatment system.
Expected Impact
Foster access to safe sanitation while saving valuable water sources.
How is this information gathered?
Investment opportunities with potential to contribute to sustainable development are based on country-level SDG Investor Maps.
Disclaimer
UNDP, the Private Finance for the SDGs, and their affiliates (collectively “UNDP”) do not seek or solicit investment for programmes, projects, or opportunities described on this site (collectively “Programmes”) or any other Programmes, and nothing on this page should constitute a solicitation for investment. The actors listed on this site are not partners of UNDP, and their inclusion should not be construed as an endorsement or recommendation by UNDP for any relationship or investment.
The descriptions on this page are provided for informational purposes only. Only companies and enterprises that appear under the case study tab have been validated and vetted through UNDP programmes such as the Growth Stage Impact Ventures (GSIV), Business Call to Action (BCtA), or through other UN agencies. Even then, under no circumstances should their appearance on this website be construed as an endorsement for any relationship or investment. UNDP assumes no liability for investment losses directly or indirectly resulting from recommendations made, implied, or inferred by its research. Likewise, UNDP assumes no claim to investment gains directly or indirectly resulting from trading profits, investment management, or advisory fees obtained by following investment recommendations made, implied, or inferred by its research.
Investment involves risk, and all investments should be made with the supervision of a professional investment manager or advisor. The materials on the website are not an offer to sell or a solicitation of an offer to buy any investment, security, or commodity, nor shall any security be offered or sold to any person, in any jurisdiction in which such offer would be unlawful under the securities laws of such jurisdiction.
Case Studies
Country & Regions
- South Africa: Western Cape
- South Africa: Eastern Cape
- South Africa: Northern Cape
Sector Classification
Infrastructure
Development need
South Africa faces significant challenges in achieving SDG 9- Industry, Innovation and Infrastructure, with a score of 45.0. Scores for other goals include 48.7 for SDG 3 - Good Health and Wellbeing, 67.0 for SDG 6 - Clean Water and Sanitation, 79.0 for SDG 7 - Affordable and Clean Energy, and 77.9 for SDG 11 - Sustainable Cities and Communities.(1)
Policy priority
The National Planning Committee identified 9 primary challenges, 4 of which have infrastructure development needs and implications: the public health system cannot meet demand or sustain quality, the economy is unsustainably resource intensive, spatial divides hobble inclusive development, and infrastructure is poorly located, inadequate and undermaintained.(2)
Gender inequalities and marginalization issues
Poor infrastructure can exacerbate the gender gap. In low income countries, women collect over 70% of water and fuelwood. Women spend 200 million hours on water collection every day. Unsafe and low security transport also disadvantage women who are more affected by violence, which affects their wellbeing and workforce participation.(8)
Investment opportunities
President Ramaphosa has an investment drive to mobilise $100 billion for priority sectors, including the energy, water, transport and logistics, and data and ICT sectors.(4) The Sustainable Infrastructure Development Symposium South Africa organised by the Investment and Infrastructure Office within the Presidency seeks to create a $20.5 billion infrastructure fund.(5)
Key bottlenecks
High fixed costs, high levels of debt and low cash reserves may cause a liquidity crisis.(6) Construction was restricted during lockdown and sharp contractions of fixed investment can be expected as firms reconsider or postpone implementation.(7) Projects exposed to foreign currency risk foreign exchange fluctuations and further uncertainty if not previously hedged.(6)
Utilities
Development need
Because of climatic conditions, by 2050, many parts of South Africa are expected to be vulnerable to water supply risks.(10)
Policy priority
The issue of water security for South Africa impacts South Africa's entire economy.(9)
Gender inequalities and marginalization issues
Inadequate access to sanitation and hygiene facilities disproportionally affects poor women and girls, constraining educational pursuits and putting personal safety at risk.(8)
Investment opportunities
An estimated ~R90 billion per year of investment is needed in water and sanitation infrastructure over the next 10 years. Public funding gaps provide an opportunity for private sector financing of water and sanitation projects to achieve access to adequate and equitable sanitation and hygiene for all South Africans.(10)
Water Utilities and Services
Pipeline Opportunity
Dry sanitation technologies
Develop and provide self-sufficient dry on-site toilets in peri-urban and informal settlements that are outside the network of a wastewater treatment system.
Business Case
Market Size and Environment
9-10 million people still need access to sanitation services.
In 2017, 83% of the national population had access to improved sanitation facilities, which means that between 9-10 million people still need access to sanitation services. Millions of South Africans still live in informal settlements, without adequate access to proper toilets.(11)
Municipalities with informal and peri-urban settlements that do not have existing sewerage systems are the principal markets for a standalone system.
Indicative Return
20% - 25%
The OMNI processor has a proven track record in Africa. Financial modelling suggests producing coolant may be a financially viable scenario. The corresponding internal rate of return at 20 years for water optimized as coolant was 24.6%.(13)
Investment Timeframe
Long Term (10+ years)
The OMNI processor has a 20-year investment timeframe.(13)
Ticket Size
USD 1 million - USD 10 million
Market Risks & Scale Obstacles
Capital - CapEx Intensive
Market - High Level of Competition
Market - Highly Regulated
Impact Case
Sustainable Development Need
Because of climatic conditions, by 2050, many parts of South Africa are expected to be vulnerable to water supply risks.(16)
More efficient use and management of water are critical to addressing the growing demand for water, threats to water security and the increasing frequency and severity of droughts and floods resulting from climate change.(17)
Failure to provide adequate and functional sanitation can lead to disastrous impacts on the health and social wellbeing of communities, the environment and the economy of the country.(18)
Gender & Marginalisation
Inadequate access to sanitation and hygiene facilities disproportionally affects poor women and girls, constraining educational pursuits and putting personal safety at risk.(19)
Expected Development Outcome
Increase safe and equitable access to decent sanitation and resources such as water, electricity and bricks; reduce demand for valuable water sources (21); create climate-smart solutions and opportunities for access to the circular economy
Gender & Marginalisation
Help women and girls access sanitation and hygiene services.
Primary SDGs addressed

1.4.1 Proportion of population living in households with access to basic services
Proportion of population living in households with access to (i) improved sanitation facilities: 82.0%; (ii) improved electricity: 89.6%; (iii) improved water facilities: 86.4% in 2017.(17)
South Africa’s key poverty reduction program (2000) provides assistance to 17 million South Africans. In 2015 social grants covered 71.9% of all elderly persons and 92.2% of those classified as poor, one-third of households with children and 61.3% of poor households with children. Expenditures on social grants are expected to rise by 26% between 2016/17 and 2019/20.(26)

6.2.1 Proportion of population using (a) safely managed sanitation services and (b) a hand-washing facility with soap and water
Proportion of population using safely managed sanitation services, including a handwashing facility with soap and water - Basic service: 70% (2017); limited service: 13% (2017); unimproved: 15% (2017); open defecation: 2% (2017).(26)
N/A
Secondary SDGs addressed


Directly impacted stakeholders
People
Gender inequality and/or marginalization
Planet
Corporates
Public sector
Indirectly impacted stakeholders
People
Gender inequality and/or marginalization
Planet
Corporates
Public sector
Outcome Risks
Dry sanitation technologies may require more maintenance than standard toilets and sanitation systems.
Improperly or poorly maintained systems can lead to odors, insects, and health hazards.(22)
Impact Risks
Endurance risk due to backlash from local communities (due to the negative perceptions associated with non-water sanitation options such as composting toilets) or vandalism of the toilets.(23)
Evidence risk due to insufficient high-quality data to know what impact is occurring
Impact Classification
What
This investment could assist providing sustainable sanitation solutions that reduce water usage and make providing sanitation to remote areas easier.
Who
Underserved low income citizens without access to running water and sanitation infrastructure. Also, local municipalities and citizens living in remote regions and drought affected areas.
Risk
Medium risk: While the model is based on a robust evidence base, external factors may affect the ability of this opportunity to deliver the expected impact.
Impact Thesis
Foster access to safe sanitation while saving valuable water sources.
Enabling Environment
Policy Environment
National Water and Sanitation Master Plan 2019: Volume 1 encourages cost-reflective tariffs, alternative water source development, and private sector financing for municipal infrastructure. The plan also calls for creating a water and sanitation infrastructure.(24)
National Sanitation Policy: This policy endorses the national sanitation targets, as outlined in the government's Medium Term Strategic Framework, to increase in the percentage of households with access to a functional sanitation service.(25)
Financial Environment
Financial incentives: The South African government has a subsidy scheme for providing basic water and sanitation services.
Other incentives: Government has committed to invest 10% of gross domestic product to 3 key areas, namely transport, energy and water, over the next couple of years.(3) Key grants include the Equitable Share, Municipal Infrastructure Grants, Regional Bulk Infrastructure Grants and the new Water Services Development Grant.(26).
Regulatory Environment
Water services and sanitation in South Africa is governed and regulated by the Department of Water and Sanitation.(5)
National Water Act and Water Services Act: These Acts form the overarching legal framework for water and sanitation, creating an enabling environment for achieving SDG 6 - Clean Water and Sanitation. The Water Services Act supports SDG targets 6.1 and 6.2.(17)
Strategic Framework on Water Services 2003 (SFWS): This framework expands on the Water Services Act and provides a comprehensive summary of policy relating to South Africa's water service sector.
Municipal Finance Management Act, Municipal Services Act
Marketplace Participants
Private Sector
Development Bank of Southern Africa, GAIA Infrastructure Capital, Acumen, Novastar and Eleos, EcoSan, EnviroLoo, Enviro Options, Dow and SAP
Government
Tsogang Rural Development Agency
Non-Profit
GreenCape, Non-Water Sanitation South Africa, NGO BIOI, Bill and Melinda Gates Foundation, Sanergy, Bremen Overseas Research and Development Association (BORDA), University of KwaZulu-Natal (UKZN)
Target Locations
South Africa: Western Cape
South Africa: Eastern Cape
South Africa: Northern Cape
References
- (1) Sachs, J., Schmidt-Traub, G., Kroll, C., Lafortune, G., Fuller, G., Woelm, F. (2020). The Sustainable Development Goals and COVID-19. Sustainable Development Report 2020. Cambridge: Cambridge University Press. https://dashboards.sdgindex.org/#/ZAF
- (2) National Science and Technology Forum (2019). The National Development Plan. http://www.nstf.org.za/wp-content/uploads/2019/04/All-The-NDP-1.pdf
- (3) Le Roux, A., Arnold, K., Makhanya, S. and Mans, G. (2019). South Africa’s urban future: Growth projections for 2050. Green Book. https://pta-gis-2-web1.csir.co.za/portal2/apps/GBCascade/index.html?appid=3c4901e8681244d1a7989e8ed2ace1f9
- (4) Industrial Development Corporation (2019). The Case For Investing in South Africa. https://sainvestmentconference.co.za/wp-content/uploads/2019/11/The-case-for-investing-in-South-Africa-2019-Executive-summary-31-October-2019.pdf
- (5) Sustainable Infrastructure Development Symposium (2020). Sustainable Infrastructure Development Symposium South Africa. https://sidssa.org.za/
- (6) Deloitte (2020). The Impact of COVID-19 on infrastructure projects and assets. https://www2.deloitte.com/content/dam/Deloitte/ng/Documents/finance/ng-the-Impact-of-COVID-19-on-Infrastructure-project-and-assets_27052020.pdf
- (7) Arndt, C., Davies, R., Gabriel, S., Harris, L., Makrelov, K., Modise, B., Robinson, S., Simbanegavi, W., van Seventer, D. and Anderson, L. (2020). Impact of Covid-19 on the South African economy. https://sa-tied.wider.unu.edu/sites/default/files/pdf/SA-TIED-WP-111.pdf
- (8) Organization for Economic Cooperation and Development (2019). Gender Equality and Sustainable Infrastructure. http://www.oecd.org/governance/gender-equality-and-sustainable-infrastructure-paris-march-2019.htm
- (9) South African Government (2018). National Water and Sanitation Master Plan: vol 2. http://www.dwa.gov.za/National%20Water%20and%20Sanitation%20Master%20Plan/default.aspx
- (10) GreenCape (2020). Water Market Intelligence Report. https://www.greencape.co.za/assets/Uploads/WATER_MARKET_INTELLIGENCE_REPORT_19_3_20_WEB.pdf
- (11) ArcGIS Story Maps (2019). Water supply in rural areas. https://storymaps.arcgis.com/stories/90726cbb3b92462eb3d6072fba53cbfa
- (12) Engineering News (2018). Enviro Loo lauded for contribution to water saving in South Africa. https://m.engineeringnews.co.za/article/enviro-loo-lauded-for-contribution-to-water-saving-in-south-africa-2018-01-11/rep_id:4433
- (13) Steps for Sanitation (2018). Sanitation Technology Platform: A J-Op Case Study: Dakar, Senegal. https://stepsforsanitation.org/wp-content/uploads/2019/01/DakarCaseStudy_FINAL_v3.pdf
- (14) RESET (2020). The Omni Processor: Turning Sewage into Drinking Water in Senegal. https://en.reset.org/blog/omni-processor-turning-sewage-drinking-water-senegal-and-beyond-01112020
- (15) Non-Water Sanitation International (2020). Overview. https://www.nonwatersanitation.org/south-africa.html
- (16) GreenCape (2019). Water Market Intelligence Report. https://www.greencape.co.za/assets/Uploads/WATER-MIR-2019-WEB-01-04-2019.pdf
- (17) Statistics South Africa (2019). South Africa SDG Report. http://www.statssa.gov.za/MDG/SDGs_Country_Report_2019_South_Africa.pdf
- (18) Western Cape Provincial Program (2017). Sustainable and Dignified Sanitation: Water, Sanitation and Hygiene.
- (19) Organization for Economic Cooperation and Development (2019). Gender Equality and Sustainable Infrastructure. http://www.oecd.org/governance/gender-equality-and-sustainable-infrastructure-paris-march-2019.htm
- (20) GreenCape (2019). Water Market Intelligence Report. https://www.greencape.co.za/assets/Uploads/WATER-MIR-2019-WEB-01-04-2019.pdf
- (21) Non-Water Sanitation (2017). Cape Town Non-Water Sanitation Plan. https://www.nonwatersanitation.org/uploads/4/5/7/2/45727331/cape_town_waterless_sanitation_solutions.pdf
- (22) EnviroLoo (2020). About Us. http://www.enviro-loo.com/Enviro-Loo-Brochure.pdf
- (23) Email correspondence with Gerrit Heynes from 17Africa on 22/7/2020.
- (24) South African Government (2011). SA National Development Plan. https://www.gov.za/sites/default/files/gcis_document/201409/devplan2.pdf
- (25) South African Government (2016). National Sanitation Policy. https://www.fsmtoolbox.com/assets/pdf/194_-_17005SC_POLICY_National_Sanitation_Policy_2016_FINAL310117.pdf
- (26) McNamara, A. (2018). Water Finance and Investment in South Africa. National Business Initiative. https://www.nbi.org.za/wp-content/uploads/2018/04/Water-Finance-and-Investment-in-South-Africa-.pdf
- (27) Statistics South Africa (2018). Latest Household Statistics 2018. http://www.statssa.gov.za/?p=11241
- (28) United Nations (2019). South Africa Voluntary National Review: Empowering People and Ensuring Inclusiveness and Equality. https://sustainabledevelopment.un.org/memberstates/southafrica

