


Culinary innovation through responsible consumption of local products
Culinary innovation through responsible consumption of local products
Business Model Description
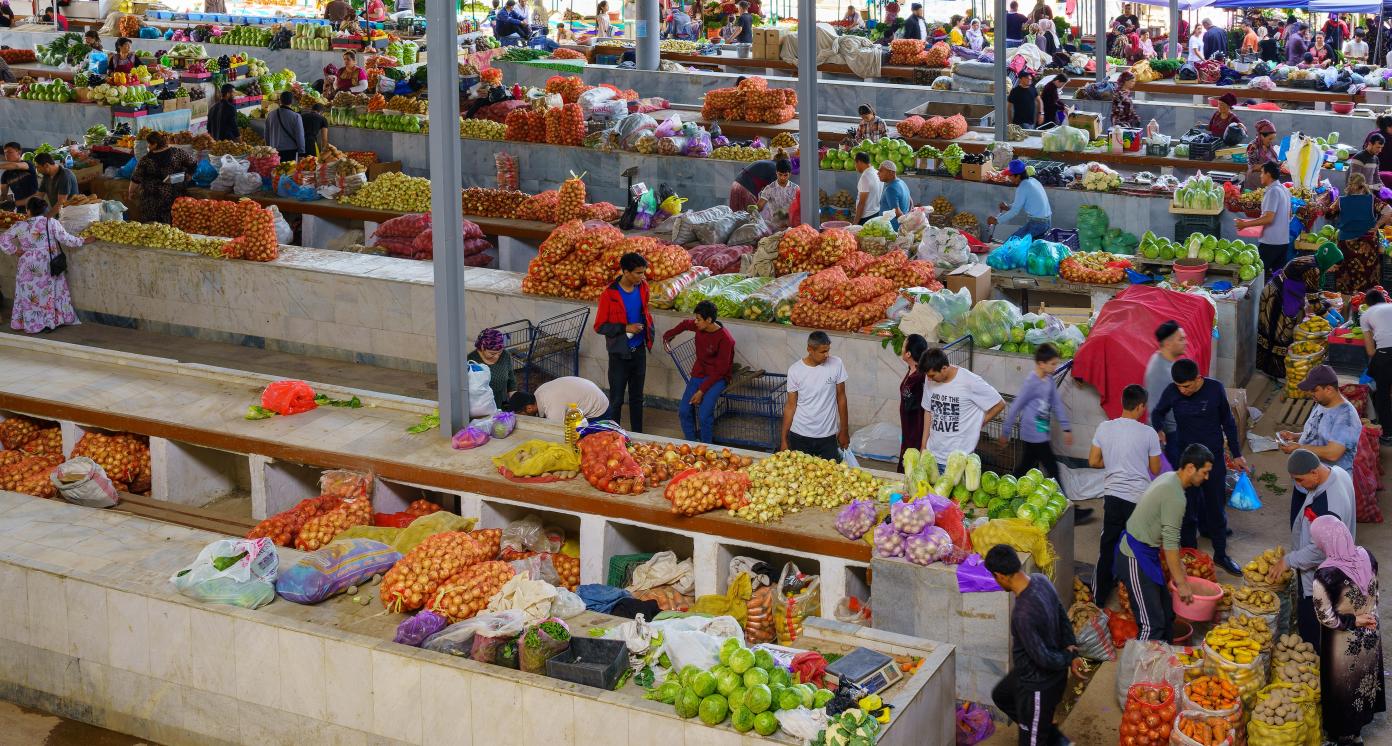
Revalorize ancient customs and traditions through culinary activities closely linked to the environment of rural communities, reconnecting with tradition and preserving knowledge about the fields and how they provide a wide variety of foods.
Expected Impact
Promoting local consumption while respecting the traditional knowledge of community farmers.
How is this information gathered?
Investment opportunities with potential to contribute to sustainable development are based on country-level SDG Investor Maps.
Disclaimer
UNDP, the Private Finance for the SDGs, and their affiliates (collectively “UNDP”) do not seek or solicit investment for programmes, projects, or opportunities described on this site (collectively “Programmes”) or any other Programmes, and nothing on this page should constitute a solicitation for investment. The actors listed on this site are not partners of UNDP, and their inclusion should not be construed as an endorsement or recommendation by UNDP for any relationship or investment.
The descriptions on this page are provided for informational purposes only. Only companies and enterprises that appear under the case study tab have been validated and vetted through UNDP programmes such as the Growth Stage Impact Ventures (GSIV), Business Call to Action (BCtA), or through other UN agencies. Even then, under no circumstances should their appearance on this website be construed as an endorsement for any relationship or investment. UNDP assumes no liability for investment losses directly or indirectly resulting from recommendations made, implied, or inferred by its research. Likewise, UNDP assumes no claim to investment gains directly or indirectly resulting from trading profits, investment management, or advisory fees obtained by following investment recommendations made, implied, or inferred by its research.
Investment involves risk, and all investments should be made with the supervision of a professional investment manager or advisor. The materials on the website are not an offer to sell or a solicitation of an offer to buy any investment, security, or commodity, nor shall any security be offered or sold to any person, in any jurisdiction in which such offer would be unlawful under the securities laws of such jurisdiction.
Country & Regions
- Macroregion Sur
Sector Classification
Food and Beverage
Development need
- In 2022, the weight of the agricultural sector in the GDP is 6.1% (3)
- In December 2022, the year-on-year variation of the Agricultural Production Index was -0.96%, due to a decrease in agricultural activity of -2.43% (1).
- By the end of the year, the agricultural sector grew by 4.3% compared to the same period in 2021, driven by increased production in the Agricultural subsector (+5.5%) (2).
Policy priority
- Institutional Strategic Plan 2019-2024 (Modified) - MIDAGRI (Implement initiatives to improve agricultural services) (5).
- Agricultural Policy Guidelines: A guiding framework for decision-making by public and private sector actors (6).
- Food and Nutritional Security Law No. 31315: Development of public policies on food security (4).
Gender inequalities and marginalization issues
- Income disparities between men and women can affect consumption patterns in the food and beverage sector, such as:
- The average income of women is 69.6% of men's income - INEI (Sep-2022) (10).
- In 2021, men's labor income increased by 10.7%, while it decreased by 1.1% for women (11).
Investment opportunities introduction
- In 2021, it achieved a GDP growth recovery of 13.6% (12).
- The National Agricultural Policy (PNA) guides public investment towards providing services that strengthen the sector (14).
- Strategic National Development Plan 2050: references agricultural production within the framework of a broader vision of sustainable country development (7)
Key bottlenecks introduction
- Inflation was 6.43% in 2021 and 8.56% in 2022. This reduces the purchasing power of the population (15)(16).
- Agriculture in Peru has low productive efficiency, with 85% of farmers having plots smaller than 10 hectares (17).
- 17% of companies in the extractive sector reported difficulties in finding qualified personnel (18).
Restaurants
Development need
- In 2022, the accommodation and restaurant sector accounted for 2.6% of the GDP with a growth rate of 23.2% (3). By the end of 2022, the restaurant activity recorded a positive variation of 4.50% compared to December 2021, a month in which the gradual resumption of economic activities initiated in May 2020 continued (1).
Policy priority
- Law No. 31556 reduces the General Sales Tax (IGV) to 10% for small and medium-sized enterprises (MyPES) that include restaurants, among others (8).
- The National Strategic Development Plan 2050 promotes the sustainable management of nature by encouraging the development of sustainable production mechanisms and consumption habits (7).
- Law No. 1062 on Food Safety and its Regulations (30).
Gender inequalities and marginalization issues
The main sectors where women's economic activities are concentrated are: services with 36.4%, trade with 27.5%, and agriculture with 25.7% (9). However, taking MyPES in the service sector as an example, only 35.9% are led by women, reflecting an inequality in this sector (9).
Investment opportunities introduction
-Peru is one of the most renowned places for its cuisine, ranking high in Latin America and the world (21). In response to this, the Reactiva Perú program had an impact on 46,364 companies in the food production and restaurant sector, who collectively accessed more than USD 1,159 million in loans in 2020 (20).
Key bottlenecks introduction
- The limited production efficiency in the agricultural sector and the informality of suppliers restrict direct access to raw materials for restaurants. Furthermore, the inflation experienced in 2022 has raised the prices of products and services, reducing the purchasing power of the population for dining outside the home (15) (16) (17) (26).
Restaurants
Pipeline Opportunity
Culinary innovation through responsible consumption of local products
Revalorize ancient customs and traditions through culinary activities closely linked to the environment of rural communities, reconnecting with tradition and preserving knowledge about the fields and how they provide a wide variety of foods.
Business Case
Market Size and Environment
< USD 50 million
< 5%
The Gross Value Added generated by the restaurant industry in 2019 was USD 3,880 million (23).
Until 2019, the accommodation and restaurant sector generated a GDP of S/ 17,634 million, representing 3.2% of the total GDP, with an average annual growth of 5.5%, 1.4 percentage points above the national average (26).
Indicative Return
> 25%
Feasibility studies for the implementation of a restaurant estimate a return on investment between 60% and 80%. (25)
Investment Timeframe
Short Term (0–5 years)
The estimated payback period for a restaurant implementation is 3 to 4 years. (25)
Ticket Size
USD 500,000 - USD 1 million
Market Risks & Scale Obstacles
Market - Highly Regulated
Market - Volatile
Market - Consumer Preference
Impact Case
Sustainable Development Need
By August 2020, the United Nations World Food Programme identified that 7% of Peruvians had not consumed any food compared to the previous day, which equates to just over 2.3 million compatriots. (31)
Approximately 4.5 million Peruvians, which is around 13.4%, suffer from food insecurity. (31)
Gender & Marginalisation
Most rural women are responsible for food security, and while men spend 2.55 hours per week on food preparation, women dedicate 10.12 hours to this task. (9)
Expected Development Outcome
The model aims to showcase the on-site biodiversity of Andean products, highlighting ancient agriculture by reviving ancestral techniques promoted by Andean communities living at altitudes above 3500 meters above sea level.
Gender & Marginalisation
Frequently, communities face challenges when new technologies are introduced without being specifically designed for their context. In this sense, the model revitalizes knowledge that has been effective for thousands of years, enabling them to produce despite their geographic conditions.
Primary SDGs addressed
12.2.2 Domestic material consumption
During 2021, the restaurant sector contributed only 79% of the GDP, compared to a pre-pandemic baseline of 100% in 2019. According to the consulting firm, in 2022, the industry is expected to reach 99%, and in 2023, it is projected to achieve a recovery of 102%.
Objective 2 of the Health Policy for 2023 in Peru is to improve infant and maternal feeding practices by incorporating iron-rich, diverse, nutritious, locally-sourced, and appropriately portioned foods within a context of healthy eating.
8.3.1 Proportion of informal employment in total employment, by sector and sex
76.8% at the national level (78.8% Women and 75.4% Men) - 2021
Information not available as August 2023
Secondary SDGs addressed
Directly impacted stakeholders
People
Gender inequality and/or marginalization
Corporates
Public sector
Indirectly impacted stakeholders
People
Corporates
Public sector
Outcome Risks
Natural disasters or emergencies, such as heavy rains, landslides, and avalanches in the Andean regions, and cold spells in the highland areas, may prevent the optimal provision of services.
Failing to achieve equitable participation of women in creative processes and decision-making may lead to a deficiency.
Impact Risks
Possible reduced purchasing capacity of raw materials by the company.
The possibility of migration of people involved in the chain for other opportunities, such as access to education for their children, access to healthcare services, and more.
Impact Classification
What
Recovery of ancestral agricultural techniques.
Who
Rural communities integrated into all processes of the services provided.
Risk
Low participation of the target audience due to contextual issues: Strikes, unfavorable weather conditions, political crises, etc.
Contribution
Strengthening the economic activity of rural communities. In addition to research and revaluation of the biodiversity of Andean products.
Impact Thesis
Promoting local consumption while respecting the traditional knowledge of community farmers.
Enabling Environment
Policy Environment
Law of Food and Nutritional Security (4)
Agricultural Policy Guidelines (6)
National Development Strategic Plan 2050 (7)
Financial Environment
Financial incentives: - A total of 24,567 companies in the Hotels and Restaurants sector have accessed the Reactiva Perú program, with a total amount of US$4.5 million. - It's worth noting that the Hotels and Restaurants sector represents only 4.9% of the total companies that participated in the Reactiva program.
Fiscal incentives: - Superintendency Resolution No. 001-2023/SUNAT, which modifies the deadline for fulfilling certain tax obligations for the December 2022 period.
Regulatory Environment
Law No. 31556, which reduces the General Sales Tax (IGV) from 18% to 10% for tourism-related micro and small businesses, including restaurants, hotels, and tourist accommodations (8)
Regulation on Surveillance and Sanitary Control of Food and Beverages (Supreme Decree No. 007-1998-SA and its amendments) (19)
Food Safety Law and its Regulation - Law No. 1062.(30)
Marketplace Participants
Private Sector
MIL CENTRO
Government
- Ministerio de Comercio Exterior y Turismo - MINCETUR - Ministerio de la Producción: en el marco del Plan Nacional de Diversificación Productiva (PNDP)
Multilaterals
- Ministerio de Cultura
Non-Profit
Mater Iniciativa
Public-Private Partnership
CENTRAL restaurante
Target Locations

Macroregion Sur
References
- (1) INEI (2023). Informe técnico de producción nacional diciembre 2022.
- (2) MIDAGRI (2022). Informe del Valor Bruto de la Producción Agropecuaria.
- (3) BCRP (2023). Notas de estudios diciembre 2022
- (4) Congreso de la República (2021), Ley N° 31315 - Ley de seguridad alimentaria y nutriciona
- (5) MIDAGRI (2022), Plan Estratégico Institucional 2019-2024 (Modificado)
- (6) MIDAGRI (2015), Lineamiento de política agraria
- (7) PCM (2022), Plan Estratégido de Desarrollo Nacional al 2050
- (8) Congreso de la República (2022), Ley N° 31556, que promueve medidas de reactivación económica de micro y pequeñas empresas de los rubros de restaurantes, hoteles y alojamiento turísticos.
- (9) INEI (2022). Perú Brechas de Género 2022
- (10) INEI (2022). Estadísticas con Enfoque de Género
- (11) GOB.PE (2022). Brecha de ocupación laboral - Nota de Prensa
- (12) EY (2022). Guía de Negocios e Inversión en Agricultura y Agribusiness en el Perú 2022/2023
- (13) GOB.PE (2020). Gobierno crea el FAE-AGRO para inyectar S/ 2,000 millones en créditos a pequeños productores - Nota de prensa
- (14) MIDAGRI (2021), D. S. N° 017-2021-MIDAGRI, Política Nacional Agraria 2021-2030
- (15) BCRP (2022). Reporte de Inflación . Diciembre 2022
- (16) INEI (2023). Variación de los Indicadores de precios de la Economía. Diciembre 2022
- (17) MIDAGRI (2022). Problemas tipo de la agricultura peruana
- (18) MTPE (2022). Encuesta de Demanda Ocupacional (EDO)
- (19) MINSA (1998). D. S. N° 007-1998-SA. Reglamento sobre Vigilancia y Control Sanitario de Alimentos y Bebidas
- (20) MEF (2020). Listado de empresas Reactiva Perú
- (21) The Worlds 50 best (2023). 50 best Latin America's
- (22) MIL CENTRO
- (23) INEI (2020). Comportamiento de la economía peruana en el 2020
- (24) PERU-RETAIL (2022). Sector Servicios se recuperará al 100% en 2023 por menores restricciones
- (25) UPC (2017). Plan de negocio para la implementación de un restaurante
- (26) MTPE (2021). Tablero Interactivo del Empleo Informal
- (27) IDB (2022). Analysis of innovation in Peru's gastronomic industry
- (28) ADEX (2022): Snacks de Cacao y Cereales: Evolución del mercado mundial y nacional
- (29) COMEX (2021): ALOJAMIENTO Y RESTAURANTES; TRANSPORTE; Y MANUFACTURA ENTRE LOS SECTORES CON MAYOR URGENCIA DE REACTIVACIÓN ECONÓMICA
- (30) Presidencia de la República (2008), D. L. N° 1062. Ley de inocuidad de los alimentos
- (31)La República (2021): Hambre Cero apunta a reducir brechas de inseguridad alimentaria