


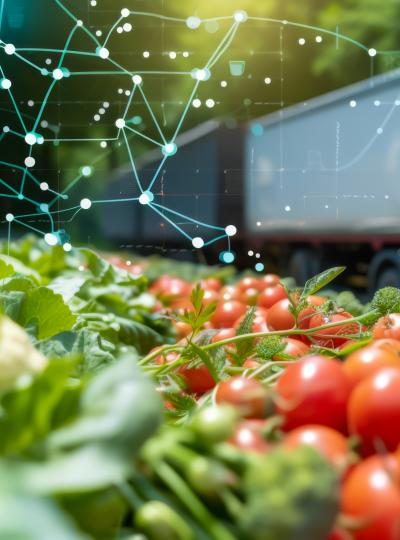


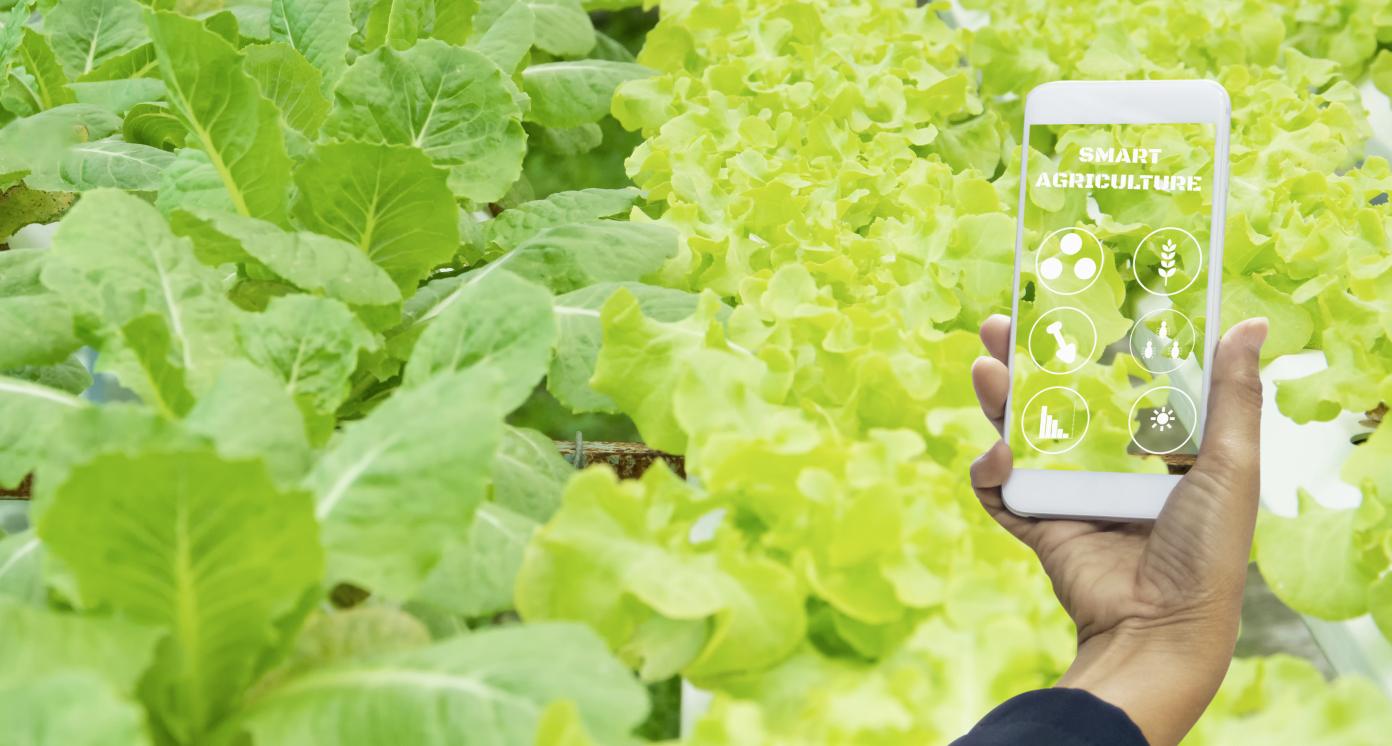
Blockchain food traceability
Blockchain food traceability
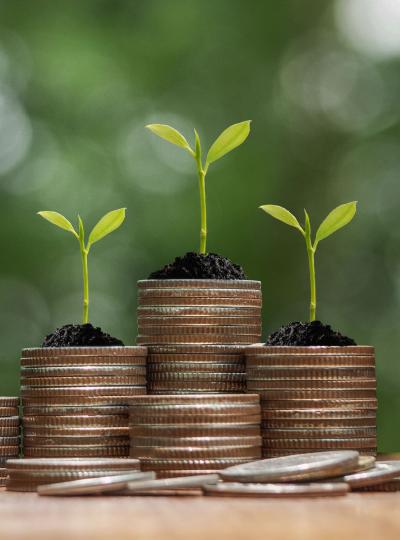
Business Model Description
Record transactions through blockchain-powered technology supplies chain participants (farmers, manufacturers, distributors) to strengthen food management, safety, and food quality. Participants and consumers can access labeling information to analyze large amounts of data and manage inventory to increase supply chain participants' income, including small producers.
Expected Impact
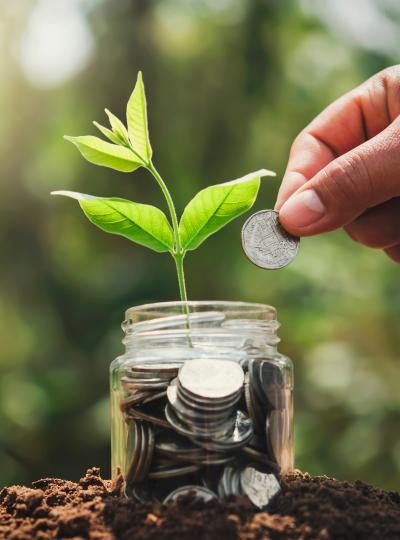
This initiative intends to allow supply chain participants to trace food origin and characteristics for waste reduction and income increase.
How is this information gathered?
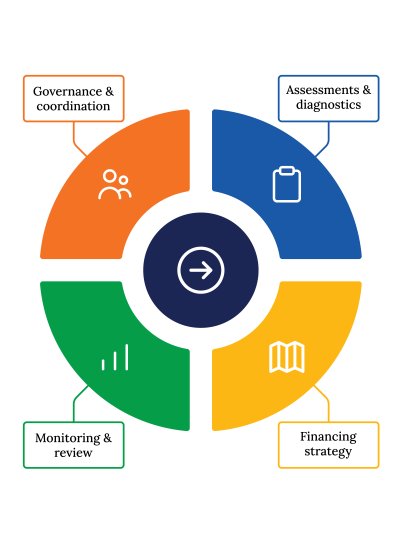
Investment opportunities with potential to contribute to sustainable development are based on country-level SDG Investor Maps.
Disclaimer
UNDP, the Private Finance for the SDGs, and their affiliates (collectively “UNDP”) do not seek or solicit investment for programmes, projects, or opportunities described on this site (collectively “Programmes”) or any other Programmes, and nothing on this page should constitute a solicitation for investment. The actors listed on this site are not partners of UNDP, and their inclusion should not be construed as an endorsement or recommendation by UNDP for any relationship or investment.
The descriptions on this page are provided for informational purposes only. Only companies and enterprises that appear under the case study tab have been validated and vetted through UNDP programmes such as the Growth Stage Impact Ventures (GSIV), Business Call to Action (BCtA), or through other UN agencies. Even then, under no circumstances should their appearance on this website be construed as an endorsement for any relationship or investment. UNDP assumes no liability for investment losses directly or indirectly resulting from recommendations made, implied, or inferred by its research. Likewise, UNDP assumes no claim to investment gains directly or indirectly resulting from trading profits, investment management, or advisory fees obtained by following investment recommendations made, implied, or inferred by its research.
Investment involves risk, and all investments should be made with the supervision of a professional investment manager or advisor. The materials on the website are not an offer to sell or a solicitation of an offer to buy any investment, security, or commodity, nor shall any security be offered or sold to any person, in any jurisdiction in which such offer would be unlawful under the securities laws of such jurisdiction.
Country & Regions
Sector Classification
Food and Beverage
Development need
19,142 companies in Colombia that are in the Food & Beverage sector
USD$ 23B in food and beverage production (16)
A 7.3% CAGR is expected until 2024 (16)
"Policy priority
> The National Development Plan (2018-2022) aims to provide business technical assistance services to 4,000 companies to improve their production and administrative processes and the use of markets. It also wants to allocate at least 50% of sector investment so that producers have access to productive assets. "
Gender inequalities and marginalization issues
> In rural areas, 36.2% of women are employed in agriculture, livestock, silviculture, and related
> Of the national total, there are 29.9% of women who identify themselves as peasants.
Investment opportunities
Several Funds have invested in the agribusiness in LatAm and Africa, such as Alive Ventures, Carabela, Catalyst Investments, EDFI, Elea Foundation, Incofin, Rabobank, among others.
Key bottlenecks
> INVIMA, the National Regulatory Agency that monitors and controls the technical-scientific character and applies sanitary standards, has presented an obstacle for companies to request the sanitary records necessary for their operation due to their lack of speed when processing a new request.
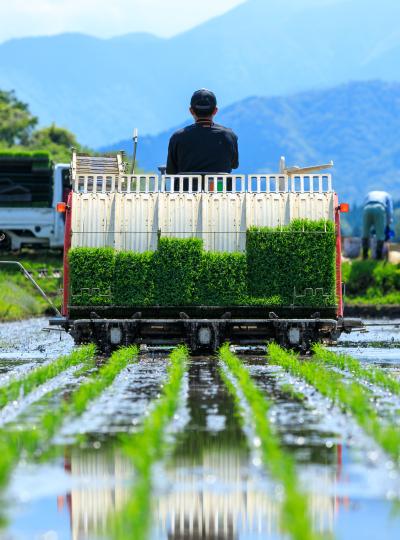
Food and Agriculture
Development need
> 9.76 million tons of food are wasted every year, a quantity that could feed 8M people yearly (1).
> The most significant losses are registered in the fruit and vegetable chains (62%) and roots and tubers (25%) (1).
> The main focus of losses occurs in the production stage, with 40.5% (3.95 million tons), followed by 19.8% (1.93 million tons) that is lost in the post-harvest process and storage and 3.5% (342 thousand tons) in industrial processing processes (1).
Policy priority
> The Seventh Permanent Constitutional Commission of Colombia approved Bill 301 of 2018, through which the policy against food loss and waste is created, in line with SDG 12.3 and hopes to reduce food waste by 50% (1).
> Law 1990 of 2019 was developed with FAO and Mesoamerica Without Hunger Program to prevent food loss and waste (1).
Gender inequalities and marginalization issues
> 2.7M hectares of agricultural use by ethnic groups, from which 86.9% correspond to forests.
Investment opportunities
> MinAmbiente and MinVivienda developed a resolution to established a unified color code for the separation of waste at the source. This resolution included the green color to indicate where usable organic waste, such as food scraps, agricultural waste, and others, should go (24).
Key bottlenecks
> Each year, Colombia produces more than 11.3 million tons of garbage, but the average rate of use is only 1.8 percent (31).
> According to the Superintendency of Domiciliary Public Services, in Colombia, there are 101 open dumps and 15 temporary cells, sites in which it is not authorized to dispose of garbage, but which continue to operate due to the lack of control and public management policies of the municipalities (32).
Processed Foods
Pipeline Opportunity
Blockchain food traceability
Record transactions through blockchain-powered technology supplies chain participants (farmers, manufacturers, distributors) to strengthen food management, safety, and food quality. Participants and consumers can access labeling information to analyze large amounts of data and manage inventory to increase supply chain participants' income, including small producers.
Business Case
Market Size and Environment
> USD 1 billion
> 25%
> Spoiler Alert charges USD$ 0.5/kg for every ton of food reallocated (18) and managed through their software. If the annual food waste is 9.76M tons (19), there is a USD$ 4.7B market.
> The global blockchain in the agriculture and food supply chain is projected to reach USD$ 948M by 2025, at a CAGR of 48.1% (17).
Indicative Return
> 25%
> 25%
According to investors interviewed, an expected return profile would result in an IRR minimum of 20% but could exceed the 30% rate.
A research conducted by "Champions 12.3" found that for every USD$ 1 that companies invested in reducing food loss and waste, they saved USD$ 14 in operating costs in three years (141% ROI) (20).
Investment Timeframe
Medium Term (5–10 years)
According to local investors interviewed, an expected holding period for in supply chain traceability and waste reduction would be between 4 to 10 years.
Ticket Size
USD 1 million - USD 10 million
Market Risks & Scale Obstacles
Capital - CapEx Intensive
Business - Business Model Unproven
Impact Case
Sustainable Development Need
> The food waste accounts for 9.76M tons of food per year, representing 34% of the total food that the country could consume during a year (8M people). These wastes are mostly related to the lack of infrastructure (1), and result in 8% of greenhouse gas emissions of the country (2).
> The costs of malnutrition in Colombia are calculated at 11% of the GDP, while 4.8% of the population (2.4M people) suffer from undernourishment (lack of access to food energy)(3).
Gender & Marginalisation
> From 2.7M hectares of agricultural use by ethnic groups, 86.9% correspond to forests.
Expected Development Outcome
> Reduce food loss and waste affect the environment due to the unsustainable use of natural resources, the generation of waste, and GHG emissions.
> Maximize transparency in the supply chain, communicating safety and quality, providing reassurance to consumers while alerting both retailers and manufacturers to food identified as unsafe. It also helps increase local food availability, which positively impacts people's health and nutrition.
Gender & Marginalisation
> Allow these ethnic groups to have an additional income by making themselves known through traceability in the chain and being able to promote their good practices.
Primary SDGs addressed
12.3.1 (a) Food loss index and (b) food waste index
12.2.1 Material footprint, material footprint per capita, and material footprint per GDP
> As of 2013, 32.4 kg per household were wasted (27).
> 429 businesses in 2017 were Green Businesses in Colombia (27).
> Colombia plans to reach 16.2 kg waste per household by 2030 (27).
> The government expects Green Businesses in Colombia to grow to 12.630 by 2030 (27).
2.1.1 Prevalence of undernourishment
> The proportion of households experiencing food insecurity was 23.5% in 2016 (27).
> The proportion of households experiencing food insecurity is expected to reach 13.9% by 2030 (27).
13.2.2 Total greenhouse gas emissions per year
> Colombia, in 24 years, has increased its GHG emissions by 10% (33).
> Colombia plans to reduce its emissions by 2030 by 20% (27).
Secondary SDGs addressed
Directly impacted stakeholders
People
Gender inequality and/or marginalization
Planet
Corporates
Public sector
Indirectly impacted stakeholders
People
Gender inequality and/or marginalization
Corporates
Public sector
Outcome Risks
The lack of technification of certain farmers will not allow them to make certificates of origin or good practices, displacing them.
Unnecessary use of pesticides to ensure sanitary regulations and quality measures.
Information that will be shared semi-publicly or publicly, giving anyone the power to view data.
Impact Risks
Execution risk: > Despite blockchain in other technologies such as bitcoin, its use in other software platforms is limited, including interoperability challenges. An analytical solution can be first implemented to test for digital adoption and generate benefits. > Investment: Implementing software tracking solutions can be expensive and time-consuming.
Stakeholder participation risk: > It is necessary to coordinate all supply chain participants (farmers, manufacturers, distributors) to record transactions to strengthen food management, safety, and food quality.
Drop off risk: > Taking into account that it requires coordination between the actors present in the supply chain, it may be that based on the participation of other actors, specific stakeholders could not comply or set aside the information record for noticing a lack of commitment from others.
External risk: > Having less food waste doesn't necessarily translate into solving the challenge of universal access to food, or having traceability does not necessarily translate into better prices.
Unexpected impact risk: > There could exist obstacles or reasons why a participant in the supply chain cannot participate, weakening others' initiative.
Gender inequality and/or marginalization risk: > Both rural women and indigenous communities may not have the necessary knowledge or technical education.
Impact Classification
What
Positive and important outcome due to improved nourishment and waste reduction.
Who
Underserved stakeholders who benefit from increased food availability and waste reduction.
Risk
Growth of waste that would make the country unsustainable and an increase in inadequate nourishment.
Impact Thesis
This initiative intends to allow supply chain participants to trace food origin and characteristics for waste reduction and income increase.
Enabling Environment
Policy Environment
(National Development Plan (2018 – 2022)): Aims to reduce food losses and waste. Currently, 34% of total food is lost as well as the number of households in which at least one of its members did not consume all three meals one or more days in the week (21).
(National Policy for the Integral Management of Solid Waste): Seeks to implement the integral management of solid waste to contribute to the promotion of the circular economy, sustainable development, adaptation, and mitigation to climate change. The preceding through the promotion of a citizen culture, an institutional environment conducive to coordination and improvement in the reporting and monitoring of waste (27).
(National Strategy for Circular Economy): Encourages producers, suppliers, and consumers to develop and implement new business models that incorporate waste management and efficient handling materials (30).
Financial Environment
Financial incentives: FINAGRO and Banco Agrario present financing alternatives for producers that present productive projects to increase productivity and reduce losses and food waste (25). Yunus Social Business has invested in companies such as S4S Technologies, that reduce waste in the agro level (13), but also in companies such as Campo Vivo that integrate all the agricultural chain from production to commercialization (14).
Other incentives: The waste produced from the agricultural sector can be reused as sources of bioenergy, for which some companies use these wastes. One of the examples is the Cali bioenergy cluster, which has 2,891 companies (28).
Regulatory Environment
(Draft Law 301 of 2018): Policy to prevent food loss and waste, which prohibits throwing away food fit for consumption, promotes donating this food to non-profit organizations (22).
(Law 1990 of 2019): Aims to prevent the waste of food fit for human consumption and prohibits the destruction of food that cannot be marketed. The CISAN will be in charge of executing the provisions of the standard (23).
(Resolution 2184 of 2019): MinAmbiente and MinVivienda developed a resolution to established a unified color code for the separation of waste at the source. This resolution included the green color to indicate where usable organic waste, such as food scraps, agricultural waste, and others, should go (24).
Marketplace Participants
Private Sector
Food Cloud is a food traceability app and marketplace that connects food stores with products about to expire with charities (26). Spoiler Alert is a software platform to manage sales and donation processes for excess food inventory that received USD$ 2.7M in investment (16). ""The Other Bar"" a chocolate bar designed in Ecuador, has generated a positive impact on the sale price and, therefore, on the producers' income.
Government
Colombia hosted the 1st LatAm Summit on Food Loss and Waste (2019), organized by FAO, IDB, and DNP, where 200 delegates from the Government, the food industry, and academia participated (1).
Public-Private Partnership
In Cali, there is an initiative for a bioenergy cluster made up of companies that generate energy and biofuels from biomass. There are currently 2,891 companies distributed in 9 parts of the production chain: distillers, power generators, agricultural machinery, transport and logistics, fertilizers, energy distributors, and research centers. This initiative was co-financed by CAF and is accompanied by the Valle government (26).
Target Locations
References
- (1) FAO (2019) - Alimentación: pasando de pérdidas a soluciones. Accessed. June 2nd 2020
- (2) Semana Sostenible (2019) - En América Latina se desperdicia el 20% de la comida que se produce en el mundo/ Accessed June 2nd 2020
- (3) FAO (2018) - Aunque en Colombia se reduce, el hambre aumenta en el mundo. Accessed May 30th 2020
- (4) ANDI (2018) – Industria de alimentos. Acceso Mayo 30
- (5) ANDI (2019) - Línea base de la situación nutricional en Colombia. Accessed May 29th 2020
- (6) DANE (2019) UPA caracterization
- (7) DANE (2016) 7th Presentation from the National Agricultural Census
- (8) Universidad del Norte (2020) Agiculture in the Colombian Caribbean
- (9) DANE (2019) UPA caracterization
- (10) Cauca Chamber of Commerce (2019) Production and Exports - Pacific Region
- (11) MinAgricultura, DANE (2016) Land use, National Agricultural Census
- (12) Fedebiocombustibles (2014) "We project to sell energy from biomass" Harold Eder
- (13) Yunus Portfolio: S4S Technologies - https://www.yunussb.com/portfolio/s4s.Accessed February 8th.
- (14) Yunus' Portfolio: Campo Vivo - https://www.yunussb.com/portfolio/campo-vivo.Accesed February 8th.
- (15) Pomona Impact's Portfolio: YellowPallet http://yellow-pallet.com/.Accessed February 8th.
- (16) EMIS (2020) Colombia: Food & Beverage Sector 2020/2021
- (17) GlobeNewswire (2020) The global blockchain in agriculture and food supply chain market size is estimated to be USD 133 million in 2020.
- (18) Spoiler Alert (2020) – More Food. Less waste. Accessed June 2nd 2020
- (19) FAO (2019) - Alimentación: pasando de pérdidas a soluciones. Accessed. June 2nd 2020
- (20) Champions 12.3 (2017) – The business case for reducing food loss and waste. Accessed June 2nd 2020
- (21) Conferencia episcopal de Colombia (2019) - Aprobado proyecto de ley para prevenir las pérdidas y desperdicios de alimentos. Access June 21st 2020
- (22) Cámara del Senado (2018) - Ley 301 del 2018. Access June 22nd 2020
- (23) ANDI (2019) – Ley 1990 del 2019
- (24) MinAmbiente (2019) Government unifies the color code for the separation of waste at the source nationwide
- (25) Finagro (2018) - "Desperdicio Cero", busca disminuir pérdida y desperdicios de alimentos en Colombia. Accessed June 22nd 2020
- (26) Semana Sostenible (2019) - La tecnología que contribuye a no desperdiciar comida. Accessed June 23rd 2020
- (27) National Planning Department (2019) - 2030 Agenda in Colombia
- (28) Cámara de Comercio de Cali (2015) Bioenergy Cluster
- (29) DNP, MinAmbiente, MinVivienda, MinEducacion, MinMinas, DANE, et al. (2016) National Policy for the Integral Management of Solid Waste
- (30) Presidency of the Republic (2019) President Duque launched the National Stratergy for Circular Economy, first enviromental policy in Latin America of this kind
- (31) Semana Sostenible (2013) Garbage in Colombia: a problem that cannot be dumped
- (32) El Tiempo (2018) The four landfills in crisis that can cause sanitary emergencies
- (33) Semana Sostenible (2018) In 24 years, the emission of greenhouse gases increased by 10% in Colombia