Biofuel and ethanol production
Business Model Description
Optimize the use of bio-waste to produce biofuel for consumer markets and electricity generation
Expected Impact
Reduce energy scarcity and dependence on import through optimized use of olive mill waste and development of cost-effective and eco-friendly biofuel production
How is this information gathered?
Investment opportunities with potential to contribute to sustainable development are based on country-level SDG Investor Maps.
Disclaimer
UNDP, the Private Finance for the SDGs, and their affiliates (collectively “UNDP”) do not seek or solicit investment for programmes, projects, or opportunities described on this site (collectively “Programmes”) or any other Programmes, and nothing on this page should constitute a solicitation for investment. The actors listed on this site are not partners of UNDP, and their inclusion should not be construed as an endorsement or recommendation by UNDP for any relationship or investment.
The descriptions on this page are provided for informational purposes only. Only companies and enterprises that appear under the case study tab have been validated and vetted through UNDP programmes such as the Growth Stage Impact Ventures (GSIV), Business Call to Action (BCtA), or through other UN agencies. Even then, under no circumstances should their appearance on this website be construed as an endorsement for any relationship or investment. UNDP assumes no liability for investment losses directly or indirectly resulting from recommendations made, implied, or inferred by its research. Likewise, UNDP assumes no claim to investment gains directly or indirectly resulting from trading profits, investment management, or advisory fees obtained by following investment recommendations made, implied, or inferred by its research.
Investment involves risk, and all investments should be made with the supervision of a professional investment manager or advisor. The materials on the website are not an offer to sell or a solicitation of an offer to buy any investment, security, or commodity, nor shall any security be offered or sold to any person, in any jurisdiction in which such offer would be unlawful under the securities laws of such jurisdiction.
Country & Regions
- Jordan: Countrywide
- Jordan: Countrywide
Sector Classification
Renewable Resources and Alternative Energy
Development need
Jordan scores 92.2 on SDG 7 (Affordable and Clean Energy), 85.8 on SDG 12 (Responsible Consumption and Production), and 94.8 on SDG 13 (Climate Action) in Sustainability Development Report 2019, with 'challenges remaining' subscores prevalent across indicators (1).
Policy priority
Jordan’s energy strategy 2020-2030 stresses the need to meet the expected increase in energy demand driven by industrialization, population growth, economic growth, and refugees (5). This strategy aims to boost the contribution of renewable energy to reach 14% by 2030 up from 11% in 2020 (6).
Gender inequalities and marginalization issues
Main challenges facing gender empowerment in the energy sector in Jordan are gender data availability, collection, and analysis; the weak cooperation and coordination between all stakeholders working on women empowerment; the lack of education and awareness RE technologies and entrepreneurship in rural areas for both men and women. (8b)
Investment opportunities introduction
With about 39% energy consumption increase between 2010-2018 and projected 17% energy demand growth in 2030, Jordan faces high risk due to limited grid capacity (4). Jordan imports 93% of its fossil fuel, mainly for power generation and transportation (3).
Alternative Energy
Investment opportunities introduction
To meet increased energy demand and diversify its renewable energy sources, Jordan needs to increase investment in renewable energy in electricity generation from 11% in 2020 to 31% in 2030 (7,8).
Biofuels
Pipeline Opportunity
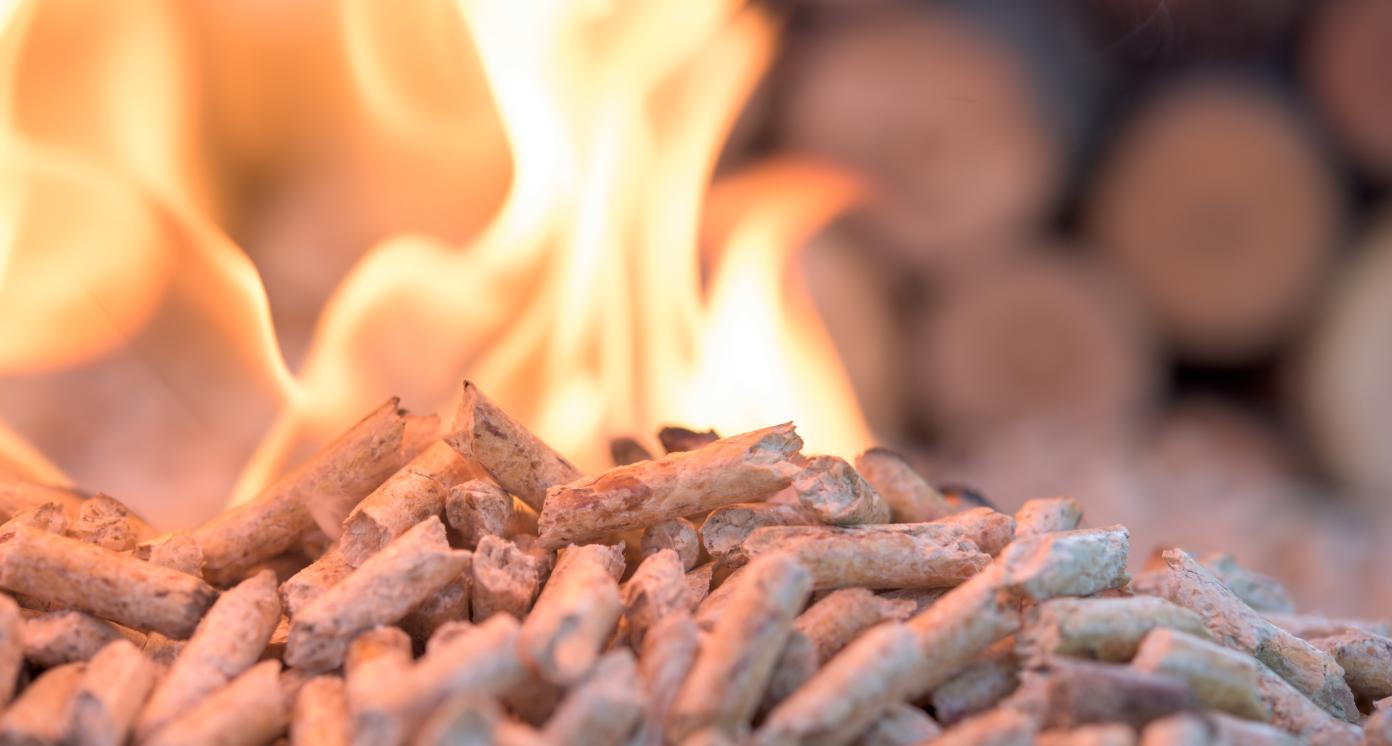
Biofuel and ethanol production
Optimize the use of bio-waste to produce biofuel for consumer markets and electricity generation
Business Case
Market Size and Environment
131 olive mills in produce around 200,000 m3 of mill water and 60,000 tons of olive pomace
Global production of fuel ethanol amounted to 29 B gallon in 2019, of which 34.9 K barrels were exported. It is projected to increase to 143 B L by 2028 (12).
Biofuel produced can be used directly by electricity company to generate electricity. There are approximately 131 olive mills in Jordan that serve olive plantations and generate annually around 200,000 m3 of OMW and between 50,000-60,000 tons of olive pomace (14). It could be utilized for bio-fuel production if it was mixed with other organic waste (15).
Jordan needs to increase the share of renewable energy in electricity generation from 11% in 2020 to 31% in 2030 (13).
Indicative Return
15% - 20%
The return on investment is between 10% in first year and 19% in fifth year for biogas projects (11).
Investment Timeframe
Medium Term (5–10 years)
For a total investment cost around EUR 2 million, the recovery period is 7 years (11)
Ticket Size
USD 1 million - USD 10 million
Market Risks & Scale Obstacles
Market - Highly Regulated
Business - Business Model Unproven
Business - Supply Chain Constraints
Impact Case
Sustainable Development Need
Jordan imports 93% of its fossil fuel for power generation and transportation. According to the Ministry of Energy and Natural Resources, 10% of GDP was spent on energy (2) and the total energy costs consume 64.5% of exports in 2018. The energy cost makes up 21% of the country’s imports (3).
Exploiting renewable energy sources to increase their contribution to the total energy mix, achieving a safe renewable energy supply and promoting additional renewable investments (19).
Utilization of local bio-waste is currently underdeveloped, solid waste and liquid waste from olive oil production poses serious environmental problems. Annual cost of environmental degradation due to the improper management of waste produced by olive industry was estimated to amount to USD 2m (9).
Expected Development Outcome
Diversification of renewable energy sources.
Reduced greenhouse gas emissions. Jobs created.
Gender & Marginalisation
Primary SDGs addressed

7.2.1 Renewable energy share in the total final energy consumption
7.1.2 Proportion of population with primary reliance on clean fuels and technology
Secondary SDGs addressed


Directly impacted stakeholders
People
Indirectly impacted stakeholders
Corporates
Outcome Risks
Biofuel production can result in higher crop prices.
The production of biofuels results in GHG emissions at several stages of the process.
Impact Classification
What
Optimize the use of olive mill waste, development of cost-effective, environmentally friendly, and profitable biofuel production technologies to reduce CO2 emissions.
Who
Farmers, mill owners and small business operators who benefit from the production of the cost-effective biofuel.
Risk
There is no specific legal framework or national strategy for solid waste management in Jordan which is seriously hampering efforts to resolve waste management situation.
Impact Thesis
Reduce energy scarcity and dependence on import through optimized use of olive mill waste and development of cost-effective and eco-friendly biofuel production
Enabling Environment
Policy Environment
Energy security and the deployment of energy efficiency and renewable energy projects is a top priority for Jordan.
Financial Environment
Other incentives: Jordan has signed and ratified the United Nations Framework Convention on Climate Change since 1993 and signed Kyoto protocol on reducing greenhouse gas emission in 2003. Jordan is therefore entitled to benefit from global initiatives on Clean Development Mechanisms (CDM).
Regulatory Environment
Energy Strategy 2020 - 2030
Agriculture law (13) in 2015.
Regulation of operating, establishing and licensing olive mills in 2018.
The Renewable Energy and Energy Efficiency Law (REEEL) in 2012.
Marketplace Participants
Non-Profit
NGO and various donors active in this area.
Target Locations
Jordan: Countrywide
Jordan: Countrywide
References
- (19) IUCN ROWA (2019). Water, energy and food security Nexus in Jordan, Lebanon and Tunisia. Assessment of current policies and regulatory and legal framework. Amman, Jordan: IUCN. Pages 56-58.

