


Affordable sanitation services
Affordable sanitation services
Business Model Description
Provide affordable sanitation services, such as public latrines and wash stations, with sewage reutilization.
Expected Impact
Positive impact on good health and wellbeing and increase the quality of life in informal settlements.
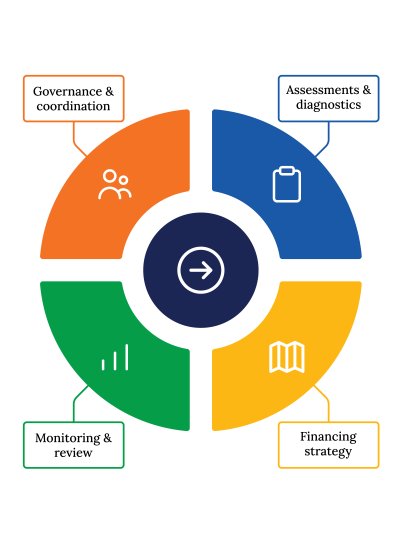
How is this information gathered?
Investment opportunities with potential to contribute to sustainable development are based on country-level SDG Investor Maps.
Disclaimer
UNDP, the Private Finance for the SDGs, and their affiliates (collectively “UNDP”) do not seek or solicit investment for programmes, projects, or opportunities described on this site (collectively “Programmes”) or any other Programmes, and nothing on this page should constitute a solicitation for investment. The actors listed on this site are not partners of UNDP, and their inclusion should not be construed as an endorsement or recommendation by UNDP for any relationship or investment.
The descriptions on this page are provided for informational purposes only. Only companies and enterprises that appear under the case study tab have been validated and vetted through UNDP programmes such as the Growth Stage Impact Ventures (GSIV), Business Call to Action (BCtA), or through other UN agencies. Even then, under no circumstances should their appearance on this website be construed as an endorsement for any relationship or investment. UNDP assumes no liability for investment losses directly or indirectly resulting from recommendations made, implied, or inferred by its research. Likewise, UNDP assumes no claim to investment gains directly or indirectly resulting from trading profits, investment management, or advisory fees obtained by following investment recommendations made, implied, or inferred by its research.
Investment involves risk, and all investments should be made with the supervision of a professional investment manager or advisor. The materials on the website are not an offer to sell or a solicitation of an offer to buy any investment, security, or commodity, nor shall any security be offered or sold to any person, in any jurisdiction in which such offer would be unlawful under the securities laws of such jurisdiction.
Country & Regions
- Kenya: North Eastern
- Kenya: Nairobi (Province)
- Kenya: Rift Valley
- Kenya: Nyanza
Sector Classification
Infrastructure
Development need
Kenya’s progress towards SDG 6 - Clean Water and Sanitation, SDG 7 - Affordable and Clean Energy and SDG 11- Sustainable Cities and Communities demonstrate major problems. The most important issues lie in access to clean water and sanitation, reliable energy transmission and last mile energy connections.(1)
Policy priority
Infrastructure is a main policy pillar for Kenya. Key policy documents/ initiatives such as the Third Medium Term Plan and Kenya Vision 2030 set the goal of providing an equitable access to utilities such as clean water and sanitation. The government also has plans to undertake affordable housing projects in partnership with the private sector.(2)
Gender inequalities and marginalization issues
Almost 46.5% of the Kenyan population lives in slums.(35) Informal settlement dwellers often have to pay high rates for low quality services. Informal settlements tend to lack basic amenities such as sewage disposal, water/sanitation and electricity.(36) Although the necessary laws were established, land ownership in Kenya is also disproportionately geared towards men.
Investment opportunities introduction
Kenya provides several incentives for infrastructure sector investors such as tax reduction rates, regional investment allowances, and wear and tear allowances on machinery for investors. There are also opportunities for public-private partnerships (PPPs) in this area. This is a policy priority for the country, and therefore high investment momentum is expected.
Key bottlenecks introduction
Some infrastructure sector bottlenecks include inequalities in the regional penetration of essential sanitation services/ facilities and housing, affordability issues for the local population, the high costs of inputs/machinery/technology for investments, high logistics costs and low levels of financial inclusion preventing the purchase of houses.
Utilities
Development need
Kenya has low water reserves of around 500 cubic meters per person. Rapid population growth and urbanization pose risks for access to clean water and sanitation. Providing equitable access to clean water will cost USD 14 billion over the next 15 years. Kenya has committed to provide universal water and sanitation by 2030 with the support of the private sector.(5)
Policy priority
The government emphasizes the need to invest in sanitation in multiple policies and strategies, such as the Kenya Environmental Sanitation and Hygiene Policy 2016-2030, the Third Medium Term Plan, Kenya Vision 2030, Kenya Health Policy 2014-2030 and the Kenya Environmental Sanitation and Hygiene Strategic Framework 2016-2020.
Gender inequalities and marginalization issues
Almost 46.5% of the Kenyan population lives in slums.(35) Informal settlement dwellers often have to pay high rates for low quality services. Informal settlements tend to lack basic amenities such as sewage disposal, water/sanitation and electricity.(36)
Investment opportunities introduction
Infrastructure is a sector with high policy momentum, and prioritized by the government. Investments in public infrastructure and utilities attract fiscal incentives. There are several opportunities for PPPs in this sector.
Key bottlenecks introduction
Household water and wastewater tariffs might exceed affordability limits in many provinces. It is essential to finance new investments without harming the poorest households.
Water Utilities and Services
Pipeline Opportunity
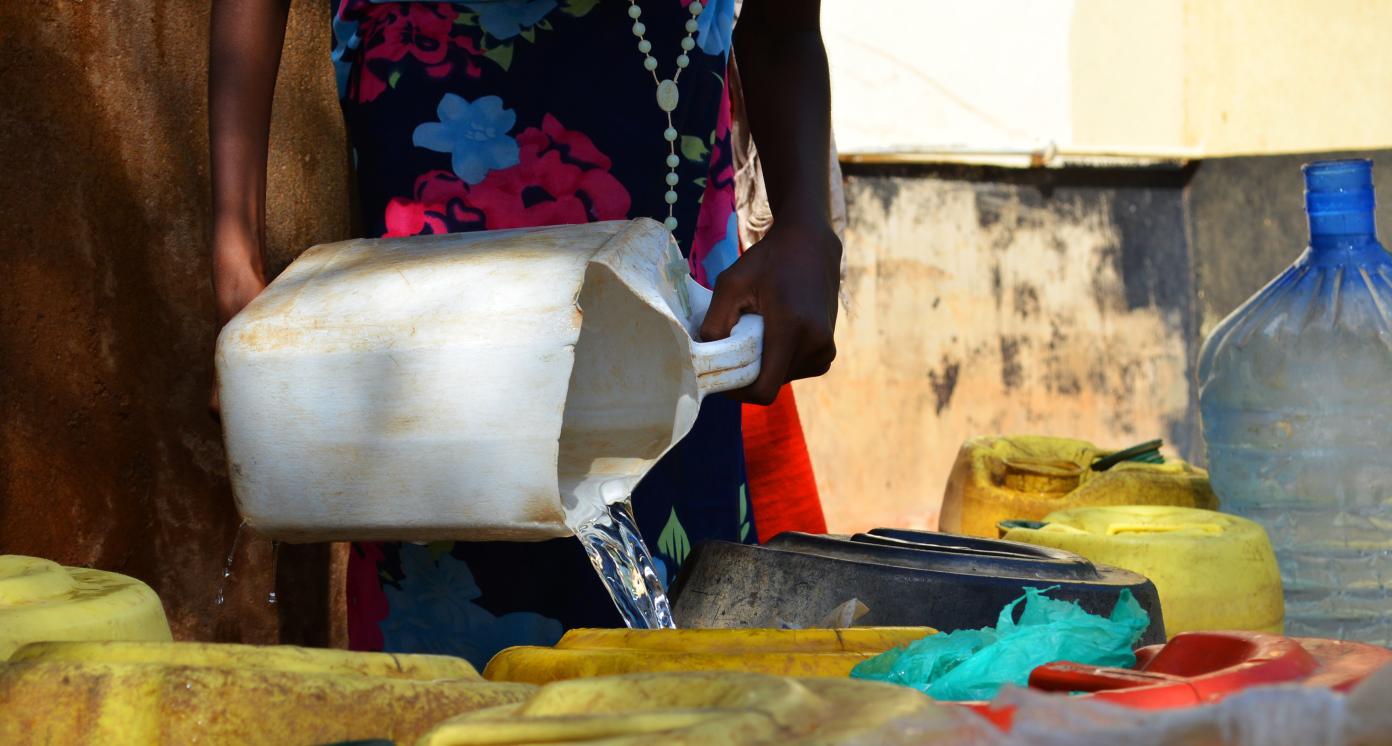
Affordable sanitation services
Provide affordable sanitation services, such as public latrines and wash stations, with sewage reutilization.
Business Case
Market Size and Environment
< USD 50 million
> 25%
Current willingness to pay (USD 3 per month), % households with sanitation facilities(14%)
The market for plastic toilet slabs (a popular and portable solution to improve sanitation) is estimated to reach USD 2.5 million by 2017 and grow at 34% annually.(6)
The current willingness to pay for sanitation services is estimated at USD 3 per month (8% of the water bill).(7)
Only 14% of Kenyan households are equipped with handwashing facilities with soap and water at home.(8)
Indicative Return
20% - 25%
Projects improving water and sanitation in Kenya achieve an internal rate of return (IRR) of 10 - 21%.(9)
Providing sanitation services for low income communities has an estimated IRR of 21%.(10)
Investment Timeframe
Medium Term (5–10 years)
Stakeholders estimated a necessary timeframe of 5 - 7 years for positive commercial returns.(11)
Ticket Size
USD 1 million - USD 10 million
Market Risks & Scale Obstacles
Capital - Requires Subsidy
Business - Supply Chain Constraints
Capital - Limited Investor Interest
Impact Case
Sustainable Development Need
Safe and clean sanitation is still a major issue in Kenya, with performance to achieve SDG 6 - Clean Water and Sanitation still stagnating.(I) According to the World Bank, only 30% of people in the country (or 30 million Kenyans) have access to improved sanitation services.(14)
Problems related to the lack of safe sanitation produce health issues. In 2018, the deaths caused by diarrhea constituted almost 15% of all deaths in Kenya. Approximately 88% of diarrhea cases are directly associated with open defecation.(15)
Gender & Marginalisation
Access to healthcare is worse for women than men in Kenya.(16) Women are particularly vulnerable to hazards related to the lack of sanitation. Women often fear using public sanitation at night due to possible abuse.(17)
The Northern counties with the worst access to basic sanitation also have the highest inequality in terms of access to healthcare by women - over 60% of women did not visit any health facility in the past year.(18)
Almost 46.5% of the Kenyan population lives in slums.(35) Informal settlement dwellers often have to pay high rates for low quality services. Informal settlements tend to lack basic amenities such as sewage disposal, water/sanitation and electricity.(36)
Expected Development Outcome
Improved sanitary conditions in highly populated areas, improved clean water access and access to affordable sanitary services
Reduced pollution of the natural environment due to the improper disposal of sewage waste, reduced cases of poisoning and disease contraction due to consumption of contaminated water
Increased quality of life and wellbeing in underserved areas
Gender & Marginalisation
Increased access to water and sanitation for informal settlement dwellers in Kenya
Primary SDGs addressed
1.4.1 Proportion of population living in households with access to basic services
Based on 2015 data: 63.20% - improved water source 41.60% - electricity 30.10% - improved sanitation services 12.76% - clean cooking fuels and technologies (37)
100%
3.9.2 Mortality rate attributed to unsafe water, unsafe sanitation and lack of hygiene (exposure to unsafe Water, Sanitation and Hygiene for All (WASH) services)
253.5 deaths per 100,000 people (37)
6.2.1 Proportion of population using (a) safely managed sanitation services and (b) a hand-washing facility with soap and water
6.3.1 Proportion of domestic and industrial wastewater flows safely treated
Share of population with access to basic handwashing facilities, 2017 - 24.65% (37)
N/A
100%
N/A
Secondary SDGs addressed
Directly impacted stakeholders
People
Planet
Indirectly impacted stakeholders
Corporates
Outcome Risks
Risk of groundwater contamination derived from latrine pits (nitrate, chloride, ammonia or microbial contaminants) (19)
Installation of septic systems in areas with shallow or saturated soils may lead to the incomplete treatment of organic and bacterial pollutants. (20)
Due to rising temperatures, flooding and other extreme weather events, faecal sludge management chains and sewer systems may pose a threat to human health and the environment.(21)
Impact Risks
Unexpected impact risks related to the outcome risks (the risk that unexpected negative impact may be produced).
Impact Classification
What
Scaling up access to sanitation services is likely to have a positive impact because it increases the overall health level and living standard of Kenyan citizens.
Who
People, who do not have access to basic sanitation services and are therefore vulnerable to the risk of infections and water-borne diseases.
Risk
Climate resilience of the sanitation system becomes an important issue and needs to be considered as the global average temperature rises.
Impact Thesis
Positive impact on good health and wellbeing and increase the quality of life in informal settlements.
Enabling Environment
Policy Environment
Third Medium Term Plan (2018 – 2022): This plan names sanitation as one of the key pillars for driving Kenya's socio-economic development.(2)
Kenya Vision 2030: This policy identifies the need for increased access to safe water and sanitation in both rural and urban areas.(22)
Kenya Health Policy 2014-2030: This policy emphasizes that each person has a right to adequate access to clean and safe water. It identifies unsafe water, sanitation and hygiene as a leading risk factor for mortality and morbidity.(23)
Kenyan Environmental Sanitation and Hygiene Policy 2016 – 2030: This policy outlines government aims to reduce open defecation to 0% and achieve 100% access to improved sanitation by 2030.
Public spending on hygiene will be increased from 0.2% of gross domestic product (GDP) to 0.9% in 2030. All these measures are to be taken with particular attention to vulnerable populations including women and girls.(24)
Kenya Environmental Sanitation and Hygiene Strategic Framework (2016-2020): This framework identifies promoting household water treatment and safety as a strategic intervention for scaling up sustainable access to improved rural and urban sanitation.(25)
Financial Environment
Fiscal incentives: Newly listed companies receive preferential corporate tax rates depending on the percentage of listed shares. (The normal rate is 30% for resident corporations and 37.5% for non-resident corporations.) (29)
Other incentives: Loans and combined financial instruments with foreign sources for investors in infrastructure are exempted from stamp duty.(31) Capital expenditures incurred in the income year on constructing public infrastructure may be an allowable deduction.(30)
Regulatory Environment
Public Health Act, Chapter 242 (Part IX – Sanitation and Housing): This Act describes the duties of authorities to maintain public cleanliness and appropriate living conditions of citizens, and provides by-laws for sanitation.(26)
Water Act, 2016 (No. 43 OF 2016): This Act provides frameworks for regulating, managing and developing water resources, and water and sewerage services.(27)
The Water Services Regulations 2019: These regulations provide a framework for local governance of water services provision, and set regulations for establishing, operating and financing water services, as well as licensing procedures, tariffs, systems and standards and administrative issues.(28)
Marketplace Participants
Private Sector
Sanergy, Lotus Africa Ltd, Freshlife, Sannivation, Wsup, Silafrica
Government
Ministry of Health, Ministry of Water and Sanitation
Multilaterals
World Bank, the European Union (EU), KfW (German Development Bank), Bill and Melinda Gates Foundation (BMGF), Standard Chartered, Acumen
Non-Profit
Water Supply and Sanitation Collaborative Council (WSSCC), Toilet Board Coalition, United Nations International Children's Emergency Fund (UNICEF) WASH (water, sanitation and hygiene) division
Target Locations

Kenya: North Eastern
Kenya: Nairobi (Province)
Kenya: Rift Valley
Kenya: Nyanza
References
- (1) Sachs, J., Schmidt-Traub, G., Kroll, C., Lafortune, G., Fuller, G., Woelm, F. (2020). The Sustainable Development Goals and COVID-19. Sustainable Development Report 2020. Cambridge: Cambridge University Press.
- (2) Republic of Kenya (2018). Third Medium Term Plan 2018 – 2022 Transforming Lives: Advancing Socio-economic Development Through The 'Big Four'.
- (3) World Bank database. https://data.worldbank.org/
- (4) Word Bank (2018). Kenya: Using Private Financing to Improve Water Services.
- (5) Office of the United Nations High Commissioner for Human Rights (2020). Right to Water in Kenya: Assessment of Access to Water in Informal Settlements. https://www.ohchr.org/Documents/Countries/KE/Assessment_right_water_Kenya2020.pdf
- (6) Peletz, R. et al. (2019). 'Assessing the Demand for Plastic Latrine Slabs in Rural Kenya', American Journal of Tropical Medicine and Hygiene. https://www.ncbi.nlm.nih.gov/pmc/articles/PMC6726948/#
- (7) Acey, C. et. al. (2018). 'Cross-subsidies for improved sanitation in low income settlements: Assessing the willingness to pay of water utility customers in Kenyan cities', World Development.
- (8) United Nations International Children's Emergency Fund. Water, Sanitation and Hygiene. https://www.unicef.org/kenya/water-sanitation-and-hygiene
- (9) World Bank (2017). Kenya - Water and Sanitation Development Project Appraisal Document 2017. http://documents1.worldbank.org/curated/en/899451500992254422/pdf/Kenya-Water-PAD-04072017.pdf
- (10) World Bank (2019). Implementation Completion and Results Report for Nairobi Sanitation OBA Project (P131512) and Nairobi Sanitation OBA II Project (P162248). http://documents1.worldbank.org/curated/en/538801548820464282/pdf/Implementation-Completion-and-Results-Report-ICR-Document-Nairobi-Sanitation-Project-P131512.pdf
- (11) UNDP/PwC Stakeholders Interviews, 2020.
- (12) Nakweya, G. (2019). Fix Africa’s Sanitation Challenges To Prevent Diseases. SciDev.Net Sub-Saharan Africa.
- (13) Van Minh, H. and Nguyen-Viet, H. (2011). 'Economic Aspects of Sanitation in Developing Countries', Environmental Health Insights. https://www.ncbi.nlm.nih.gov/pmc/articles/PMC3212862/
- (14) Wanjiku Ndungu, P. (2018). Why Kenya’s sanitation challenge requires urgent attention. February. https://blogs.worldbank.org/africacan/why-kenyas-sanitation-challenge-requires-urgent-attention
- (15) World Life Expectancy. Kenya: Diarrhoeal diseases. https://www.worldlifeexpectancy.com/kenya-diarrhoeal-diseases
- (16) Denmark in Kenya. Ensuring equal access to health services. https://kenya.um.dk/en/danida-en/gender/ensuring-equal-access-to-health-services/
- (17) Bazzano, A.N. (2019). 'A mixed-methods study of women’s sanitation utilization in informal settlements in Kenya', PLoS One. https://www.ncbi.nlm.nih.gov/pmc/articles/PMC6428280/
- (18) Fraym (2019). Women's access to health facilities in Kenya. https://fraym.io/womens-access-to-health-facilities-in-kenya/
- (19) Graham, J. and Polizzotto, M. (2013). 'Pit Latrines and Their Impacts on Groundwater Quality: a Systematic Review', Environmental Health Perspectives. https://ehp.niehs.nih.gov/doi/pdf/10.1289/ehp.1206028
- (20) Hitzhusen, F. (2011). An Economic Analysis of Poorly Sited Septic Systems. Conference Paper. Water Resources Management. https://www.researchgate.net/publication/271435555_An_economic_analysis_of_poorly_sited_septic_systems
- (21) Howard, G., Calow, R. and MacDonald, A. (2016). 'Climate Change and Water and Sanitation: Likely Impacts and Emerging Trends for Action', Annual Review of Environment and Resources. https://www.annualreviews.org/doi/full/10.1146/annurev-environ-110615-085856
- (22) National Treasury and Planning (2016). Kenya Vision 2030. https://kfcb.co.ke/wp-content/uploads/2016/08/vision_2030.pdf
- (23) Ministry of Health (2014). Kenya Health Policy 2014-2030. Republic of Kenya. http://publications.universalhealth2030.org/uploads/kenya_health_policy_2014_to_2030.pdf
- (24) Government of Kenya. Kenya Environmental Sanitation and Hygiene Policy 2016 – 2030. https://www.wsp.org/sites/wsp/files/publications/Kenya%20Environmental%20Sanitation%20and%20Hygiene%20Policy.pdf
- (25) Ministry of Health (2016). Kenya Environmental Sanitation And Hygiene Strategic Framework (2016-2020). Republic of Kenya. https://www.wsp.org/sites/wsp.org/files/publications/Kenya%20Environmental%20Sanitation%20and%20Hygiene%20Strategic%20Framework.pdf
- (26) Public Health Act, Chapter 242. http://extwprlegs1.fao.org/docs/pdf/ken129231.pdf
- (27) Water Act. https://wasreb.go.ke/downloads/Water%20Act%202016.pdf
- (28) The Water Services Regulations 2019. https://ecotourismkenya.org/wp-content/uploads/ekdownloads/press_releases/Water%20Services%20Regulations%20Draft%20Dated%2005.02.2019%20pdf.pdf
- (29) KENIvest. Investment Incentives. http://www.invest.go.ke/starting-a-business-in-kenya/investment-incentives/
- (30) Kenya Revenue Authority. Investing in Kenya. https://www.kra.go.ke/en/ngos/incentives-investors-certificate/investing-in-kenya/incentives-investors
- (31) Africa Legal Network. Investment Guide - Kenya. https://www.africalegalnetwork.com/wp-content/uploads/sites/22/2016/10/Kenya-Investment-Guide-2016.pdf
- (32) Wanjiku Ndungu, P. (2018). Why Kenya’s sanitation challenge requires urgent attention. February. https://blogs.worldbank.org/africacan/why-kenyas-sanitation-challenge-requires-urgent-attention
- (33) International Finance Corporation. Leveraging Market Opportunities to Achieve Development Impact: Entrepreneurial Solutions to Improve Access to Sanitation and Safe Water. https://www.ifc.org/wps/wcm/connect/1f2cf404-4d3e-44ed-aad8-a625496d1f68/SSAWA_FINAL_ONLINE+VERSION.pdf?MOD=AJPERES&CVID=k-ayD8K
- (34) World Bank. Health Impact and Effectiveness of Distribution Models for Plastic Latrine Slabs in Kenya. https://olc.worldbank.org/content/health-impact-and-effectiveness-distribution-models-plastic-latrine-slabs-kenya
- (35) World Bank (2020). https://data.worldbank.org/indicator/EN.POP.SLUM.UR.ZS?locations=KE
- (36) The Conversation (2018). Nairobi's slum residents pay a high price for low quality services. https://theconversation.com/nairobis-slum-residents-pay-a-high-price-for-low-quality-services-104063
- (37) SDG Tracker (2021). End poverty in all its forms everywhere. https://sdg-tracker.org/no-poverty